Unlock a world of possibilities! Login now and discover the exclusive benefits awaiting you.
- Qlik Community
- :
- All Forums
- :
- QlikView App Dev
- :
- Re: Showing 0's in Line Trend charts
- Subscribe to RSS Feed
- Mark Topic as New
- Mark Topic as Read
- Float this Topic for Current User
- Bookmark
- Subscribe
- Mute
- Printer Friendly Page
- Mark as New
- Bookmark
- Subscribe
- Mute
- Subscribe to RSS Feed
- Permalink
- Report Inappropriate Content
Showing 0's in Line Trend charts
Hi,
I am trying to plot 0 values in my Trend chart. I am loading raw data and a calendar qvd.
For some of the dates there is not data. so when displaying the trends on X-axis it is not showing all the months.
Can some one please advise
- Mark as New
- Bookmark
- Subscribe
- Mute
- Subscribe to RSS Feed
- Permalink
- Report Inappropriate Content
have a look at attached sample.

hope this helps
- Mark as New
- Bookmark
- Subscribe
- Mute
- Subscribe to RSS Feed
- Permalink
- Report Inappropriate Content
Hi,
when selecting a specific date the chart is still showing all dates.
Eg: i created a list box for quarter and when selecting a quarter it is the chart is not changing based on selection. Is it possible to make the dates dynamic.
- Mark as New
- Bookmark
- Subscribe
- Mute
- Subscribe to RSS Feed
- Permalink
- Report Inappropriate Content
have a look at the attached sample
hope this helps
- Mark as New
- Bookmark
- Subscribe
- Mute
- Subscribe to RSS Feed
- Permalink
- Report Inappropriate Content
Hi,
Actually when selecting a date field in a list box, i am trying show only relevant dates only.
- Mark as New
- Bookmark
- Subscribe
- Mute
- Subscribe to RSS Feed
- Permalink
- Report Inappropriate Content
One more try 🙂
- Mark as New
- Bookmark
- Subscribe
- Mute
- Subscribe to RSS Feed
- Permalink
- Report Inappropriate Content
Sorry Frank, it is not working. Now when i select a year or quarter if it is 0, it is not displaying the date/month/quarter
- Mark as New
- Bookmark
- Subscribe
- Mute
- Subscribe to RSS Feed
- Permalink
- Report Inappropriate Content
Next try.
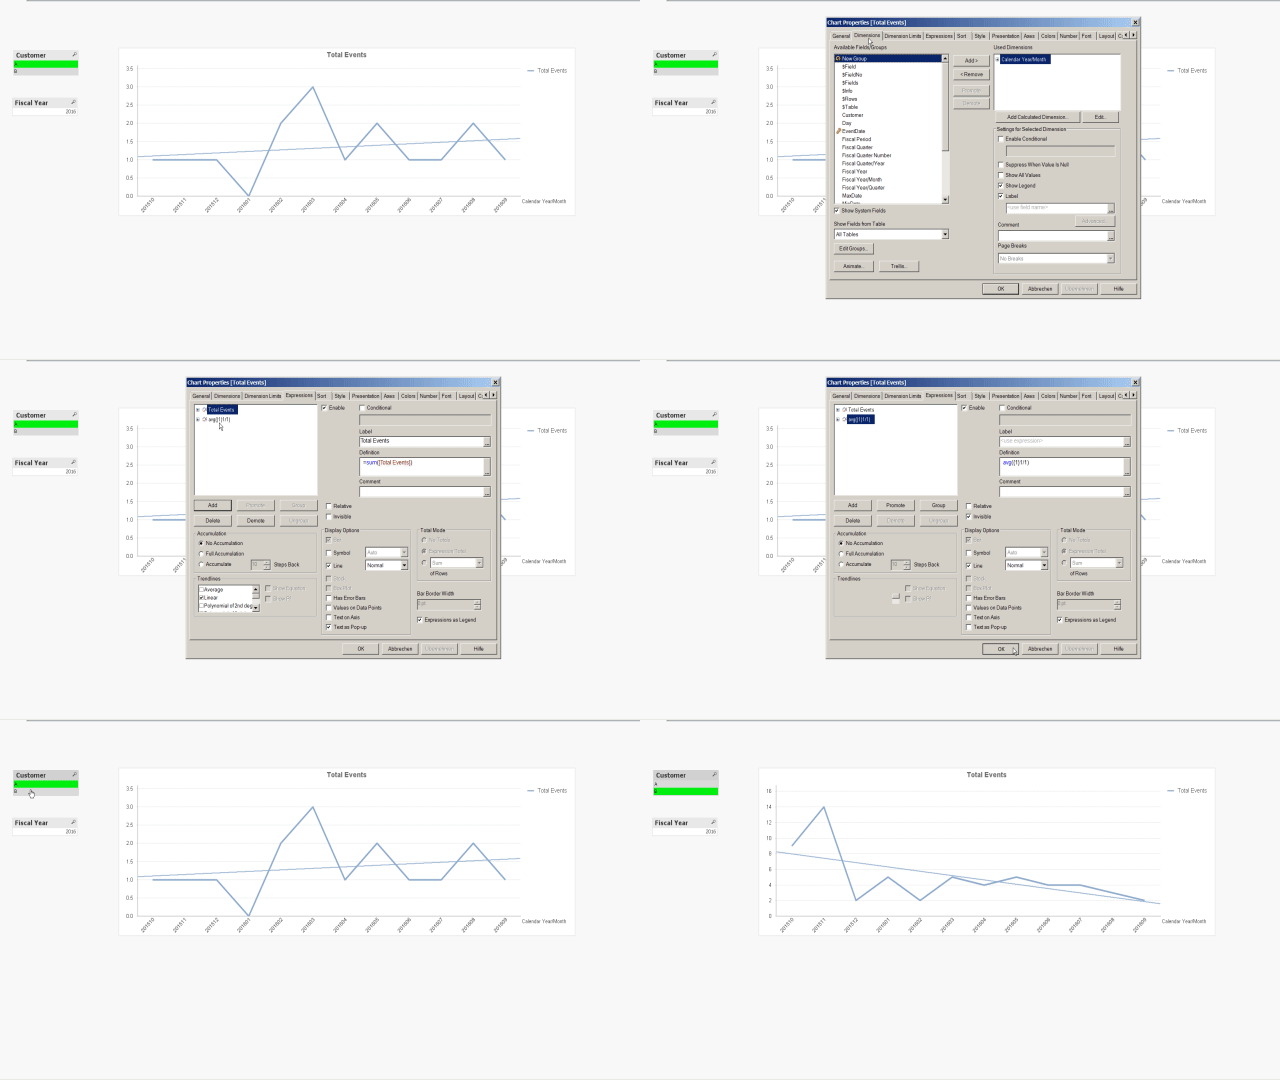
Now if you select "Customer A" and "Q1" the Nullvalue of Jan/2016 is shown.
hope we are getting closer
- Mark as New
- Bookmark
- Subscribe
- Mute
- Subscribe to RSS Feed
- Permalink
- Report Inappropriate Content
I took the second expression and yes we are coming close. Is there a way to add cyclic object in the set modifier instead of the Customer
- Mark as New
- Bookmark
- Subscribe
- Mute
- Subscribe to RSS Feed
- Permalink
- Report Inappropriate Content
see attached sample. I just added a cyclic dimension.
if this is not what you would like to achieve then please give
detailed information about expected output/behaviour!
hope this helps