Unlock a world of possibilities! Login now and discover the exclusive benefits awaiting you.
- Qlik Community
- :
- All Forums
- :
- QlikView App Dev
- :
- Re: Showing data
- Subscribe to RSS Feed
- Mark Topic as New
- Mark Topic as Read
- Float this Topic for Current User
- Bookmark
- Subscribe
- Mute
- Printer Friendly Page
- Mark as New
- Bookmark
- Subscribe
- Mute
- Subscribe to RSS Feed
- Permalink
- Report Inappropriate Content
Showing data
Hello,
I'd like to show the following data in a (like?) 3 columns-table:
A KPI description - A KPI Value - A KPI Note
B KPI description - B KPI Value - B KPI Note
C KPI description - C KPI Value - C KPI Note
All these values are stored in a different variable.
Would someone suggest to me then right object I can use to reach the goal?
Thks,
N.
Accepted Solutions
- Mark as New
- Bookmark
- Subscribe
- Mute
- Subscribe to RSS Feed
- Permalink
- Report Inappropriate Content
If you want to use a table object specifically then you can also look at ValueList() and ValueLoop() which allows you to create a custom dimension and use this to reference either expressions or variable holding the expressions. They are really handy functions so worth trying to understand.
- Mark as New
- Bookmark
- Subscribe
- Mute
- Subscribe to RSS Feed
- Permalink
- Report Inappropriate Content
Hi,
You can do one of the ways
1. By the text objects use variables there like
=$(vAKPIDesc) and so on for all A variables then
=$(vBKPIDesc) and so on for all B variables then
=$(vCKPIDesc) and so on for all C variables then
Here you need 9 text objects.
2. By any straight chart same here use the variable in the chart
Hope this hepls
Anand
- Mark as New
- Bookmark
- Subscribe
- Mute
- Subscribe to RSS Feed
- Permalink
- Report Inappropriate Content
Sorry...maybe I'm not very pratical using the straight tables...How can I set it to allow me to put 9 defined and different values in a 3x3 matrix?
Thks
- Mark as New
- Bookmark
- Subscribe
- Mute
- Subscribe to RSS Feed
- Permalink
- Report Inappropriate Content
Hi,
Create 9 text object is easy for you and keep it identical to each other i provide you simple shot for that.
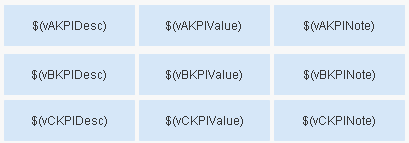
Note:- in the expression part use variable like start with equal sign and variable name =$(vAKPIDesc)
Regards,
Anand
- Mark as New
- Bookmark
- Subscribe
- Mute
- Subscribe to RSS Feed
- Permalink
- Report Inappropriate Content
Right, I've simplified my example...to tell the truth I've got to show 7 kpi (thus 21 cells): if it should be possible to store them into an unique table I prefer this solution. 😉
- Mark as New
- Bookmark
- Subscribe
- Mute
- Subscribe to RSS Feed
- Permalink
- Report Inappropriate Content
If you want to use a table object specifically then you can also look at ValueList() and ValueLoop() which allows you to create a custom dimension and use this to reference either expressions or variable holding the expressions. They are really handy functions so worth trying to understand.
- Mark as New
- Bookmark
- Subscribe
- Mute
- Subscribe to RSS Feed
- Permalink
- Report Inappropriate Content
A great suggestion ValueLoop & ValueList 
Thank you very much.
N.