Unlock a world of possibilities! Login now and discover the exclusive benefits awaiting you.
- Qlik Community
- :
- All Forums
- :
- QlikView App Dev
- :
- Re: Showing the percentage difference
- Subscribe to RSS Feed
- Mark Topic as New
- Mark Topic as Read
- Float this Topic for Current User
- Bookmark
- Subscribe
- Mute
- Printer Friendly Page
- Mark as New
- Bookmark
- Subscribe
- Mute
- Subscribe to RSS Feed
- Permalink
- Report Inappropriate Content
Showing the percentage difference
Hi All,
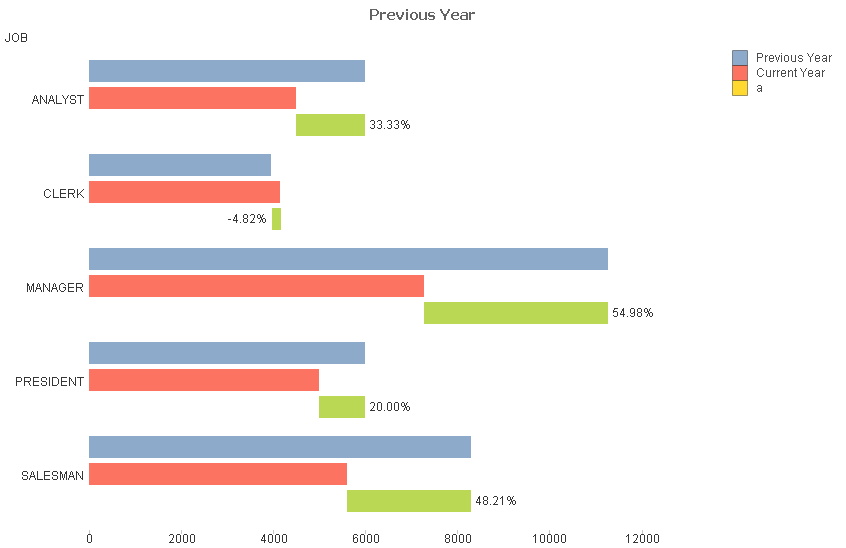
How to achieve the ((2014 SAL-2015 SAL)/2014 SAL)*100 for each JOB as shown in table and graph.
Thanks in advance.
| Year | JOB | 2014 | 2015 | SAL % |
| 2014 | ANALYST | 6000 | 4500 | 33.33 |
| 2014 | CLERK | 3950 | 4150 | -4.82 |
| 2014 | MANAGER | 11275 | 7275 | 54.98 |
| 2014 | PRESIDENT | 6000 | 5000 | 20.00 |
| 2014 | SALESMAN | 8300 | 5600 | 48.21 |
How to show as shown the graph. Please find the attached application.
- « Previous Replies
-
- 1
- 2
- Next Replies »
- Mark as New
- Bookmark
- Subscribe
- Mute
- Subscribe to RSS Feed
- Permalink
- Report Inappropriate Content
![]()
- Mark as New
- Bookmark
- Subscribe
- Mute
- Subscribe to RSS Feed
- Permalink
- Report Inappropriate Content
A small modification to Manish file. Still, not exactly as you wanted.
- Mark as New
- Bookmark
- Subscribe
- Mute
- Subscribe to RSS Feed
- Permalink
- Report Inappropriate Content
See attached file
- Mark as New
- Bookmark
- Subscribe
- Mute
- Subscribe to RSS Feed
- Permalink
- Report Inappropriate Content
Thank you for the reply.
I am getting the output like this. Please help for the attached files.
- Mark as New
- Bookmark
- Subscribe
- Mute
- Subscribe to RSS Feed
- Permalink
- Report Inappropriate Content

For me it looks like that.
- Mark as New
- Bookmark
- Subscribe
- Mute
- Subscribe to RSS Feed
- Permalink
- Report Inappropriate Content
FOr me 3rd one is not showing. What may be the reason? Am I missing something?
- Mark as New
- Bookmark
- Subscribe
- Mute
- Subscribe to RSS Feed
- Permalink
- Report Inappropriate Content
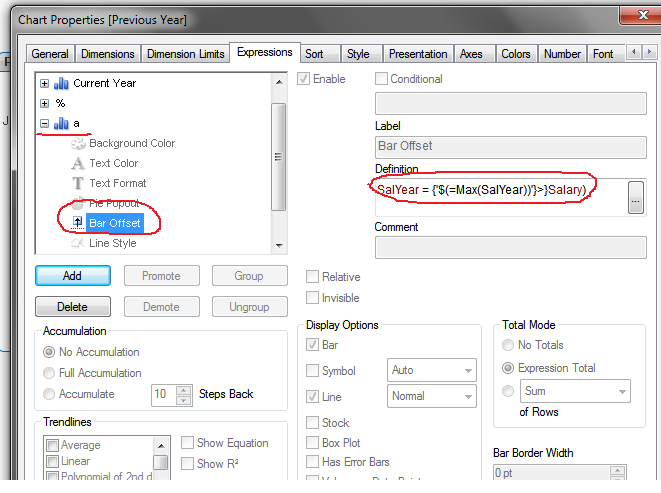
You didn't set the Bar Offset. Look at the attached file now.
- Mark as New
- Bookmark
- Subscribe
- Mute
- Subscribe to RSS Feed
- Permalink
- Report Inappropriate Content
Hi Daniel_Kusiak,
Very strange. I have done the same but not succeeded.
Could you tell me which option/settings need to do?
- Mark as New
- Bookmark
- Subscribe
- Mute
- Subscribe to RSS Feed
- Permalink
- Report Inappropriate Content
As I said before you didn't set the Bar Offset.

- Mark as New
- Bookmark
- Subscribe
- Mute
- Subscribe to RSS Feed
- Permalink
- Report Inappropriate Content
Thank you all for wonderful answers.
- « Previous Replies
-
- 1
- 2
- Next Replies »