Unlock a world of possibilities! Login now and discover the exclusive benefits awaiting you.
- Qlik Community
- :
- All Forums
- :
- QlikView App Dev
- :
- Simple (?) Count
- Subscribe to RSS Feed
- Mark Topic as New
- Mark Topic as Read
- Float this Topic for Current User
- Bookmark
- Subscribe
- Mute
- Printer Friendly Page
- Mark as New
- Bookmark
- Subscribe
- Mute
- Subscribe to RSS Feed
- Permalink
- Report Inappropriate Content
Simple (?) Count
Hi
I have a bar chart that counts how many notifications that are closed for a specific month.
Count (MID([User status],1,4='CLSD'))
no problems as my dimension is set to look for completion date (month).
Here is the trick: There are still notifications in progress that I also would like to count for the same month but as long as i have completion date as dimension, I can not get this to work.
The ultimate ansver should be a comparison between the closed notifications and the total of notifications for just this month.
I have tried like this:
Date(MonthStart([Completn date]),'MMM YYYY') as Compl.month in the script
Compl.month as Dimension
One expression is Count (MID([User status],1,4='CLSD')) Actual numbers of CLSD is 15
Next expression is Count (Total(Notification)) Actual numbers of notifications is 38
My result is
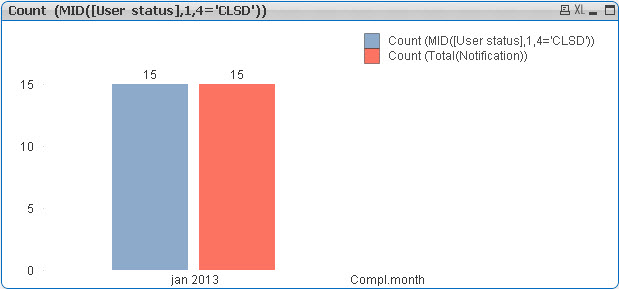
I would like the red bar to be 38 and eventually i would like to have a percentage between closed and total notifications for a specific month...
Best regards
/Mats
- Tags:
- new_to_qlikview
- « Previous Replies
-
- 1
- 2
- Next Replies »
Accepted Solutions
- Mark as New
- Bookmark
- Subscribe
- Mute
- Subscribe to RSS Feed
- Permalink
- Report Inappropriate Content
Ok, based on following table, there are 13 issues closed in Jan that have been created in Jan and 2 issues have been created only (not closed) --> TOTAL 15.
| Notification | User status | Completn date | Notif.date |
| 10766767 | CLSD | 15.01.2013 | 08.01.2013 |
| 10770184 | CLSD | 15.01.2013 | 14.01.2013 |
| 10770186 | CLSD | 15.01.2013 | 14.01.2013 |
| 10770406 | CLSD | 21.01.2013 | 15.01.2013 |
| 10773467 | CLSD | 21.01.2013 | 21.01.2013 |
| 10770017 | CLSD | 22.01.2013 | 14.01.2013 |
| 10774250 | CLSD | 22.01.2013 | 22.01.2013 |
| 10775196 | CLSD | 23.01.2013 | 23.01.2013 |
| 10776631 | CLSD | 29.01.2013 | 25.01.2013 |
| 10778208 | CLSD | 30.01.2013 | 28.01.2013 |
| 10774219 | CLSD | 31.01.2013 | 22.01.2013 |
| 10774216 | CLSD | 31.01.2013 | 22.01.2013 |
| 10778654 | CLSD | 31.01.2013 | 29.01.2013 |
| 10778343 | CLSD | 05.02.2013 | 28.01.2013 |
| 10766179 | CLSD | 08.02.2013 | 07.01.2013 |
| 10778204 | CLSD | 08.02.2013 | 28.01.2013 |
| 10779286 | CLSD | 08.02.2013 | 30.01.2013 |
| 10778340 | CLSD | 20.04.2013 | 28.01.2013 |
| 10766178 | IPRG | 07.01.2013 | |
| 10771399 | IPRG | 17.01.2013 |
Based on this table, there are 18 issues closed in Feb, that have been created in Feb and additional 5 issues have been created but not closed --> Total 23.
You are again losing 5 issues that have been closed in a later month.
| Notification | User status | Completn date | Notif.date |
| 10782636 | CLSD | 04.02.2013 | 04.02.2013 |
| 10782638 | CLSD | 04.02.2013 | 04.02.2013 |
| 10782624 | CLSD | 04.02.2013 | 04.02.2013 |
| 10782622 | CLSD | 04.02.2013 | 04.02.2013 |
| 10782857 | CLSD | 08.02.2013 | 05.02.2013 |
| 10786835 | CLSD | 11.02.2013 | 11.02.2013 |
| 10786837 | CLSD | 11.02.2013 | 11.02.2013 |
| 10784637 | CLSD | 18.02.2013 | 07.02.2013 |
| 10791902 | CLSD | 19.02.2013 | 19.02.2013 |
| 10792143 | CLSD | 19.02.2013 | 19.02.2013 |
| 10792111 | CLSD | 19.02.2013 | 19.02.2013 |
| 10792142 | CLSD | 19.02.2013 | 19.02.2013 |
| 10792826 | CLSD | 19.02.2013 | 19.02.2013 |
| 10786963 | CLSD | 20.02.2013 | 12.02.2013 |
| 10791282 | CLSD | 20.02.2013 | 18.02.2013 |
| 10792106 | CLSD | 20.02.2013 | 19.02.2013 |
| 10792102 | CLSD | 21.02.2013 | 19.02.2013 |
| 10796210 | CLSD | 26.02.2013 | 25.02.2013 |
| 10792145 | CLSD | 13.03.2013 | 19.02.2013 |
| 10786804 | CLSD | 19.03.2013 | 11.02.2013 |
| 10792110 | CLSD | 24.04.2013 | 19.02.2013 |
| 10791269 | CLSD | 25.04.2013 | 18.02.2013 |
| 10791884 | CLSD | 25.04.2013 | 19.02.2013 |
| 10793616 | IPRG | 20.02.2013 | |
| 10793621 | IPRG | 20.02.2013 | |
| 10794052 | IPRG | 21.02.2013 | |
| 10794352 | IPRG | 21.02.2013 | |
| 10794844 | IPRG | 22.02.2013 |
Seems to me that this is what you want to see:
Instead grouping by Completion month, you need to group by Notif. month (reason: there is no Completion date for User status IPRG, that you will need to account for in your total issue number for that month).
Then look for the issues that were closed in the same month than created:
=count( distinct {<Notification = {"=[Notif month]=[Completn month]"}, [User status] = {CLSD} >} Notification)
and count the number of IPRG status for that month:
=count({<[User status] = {IPRG}>} Notification)
adding the two gives you the total (23 for Feb).
I haven't understood how you want to calculate the percentage from the difference, but that should be easy for you.
- Mark as New
- Bookmark
- Subscribe
- Mute
- Subscribe to RSS Feed
- Permalink
- Report Inappropriate Content
I believe your request is similar to this one: http://community.qlik.com/message/342059#342059
so please have a look at the proposed solution over there.
Please also recheck your expression:
MID([User status],1,4='CLSD')
I believe you want to compare the string returned from MID, not 4 with a string?
Mid([User status],1,4) = 'CLSD'
Then, to prevent to count matching as well as not matching [User status] values, you should use something like
if(Mid([User status],1,4) = 'CLSD', [User status])
with an implicite NULL for not matching entries.
--> count( if(Mid([User status],1,4) = 'CLSD', [User status]) )
- Mark as New
- Bookmark
- Subscribe
- Mute
- Subscribe to RSS Feed
- Permalink
- Report Inappropriate Content
Hi
Thanks for your answer but it's not really what i had in mind.
Please look at the attached files.
Dimension is Compl.date (jan-april)
On one bar i would like to have the number of closed (CLSD) notifications (15, 23, 71, 38) and on an other bar i would like to have the total (CLSD+IPRG) of notifications for that specific month (41, 49, 97, 64).
My final composition should be the difference between number of closed notifications and the total number of notifications in percent (Notification Gap for each month), based on Compl.date.
Best regards
/Mats
- Mark as New
- Bookmark
- Subscribe
- Mute
- Subscribe to RSS Feed
- Permalink
- Report Inappropriate Content
Sorry, I don't get how you calculate the total number for a month, for example 41 for jan, taken your sample xlsx.
- Mark as New
- Bookmark
- Subscribe
- Mute
- Subscribe to RSS Feed
- Permalink
- Report Inappropriate Content
Hi
If I filter the Completn date with January+blanks I get all notifications for that month, CLSD and IPRG, 41 in total.
/Mats
- Mark as New
- Bookmark
- Subscribe
- Mute
- Subscribe to RSS Feed
- Permalink
- Report Inappropriate Content
I only get 41 records for Jan if I count incl. Notifications like 10793616, which shows a Notif. date 20.02.2013, which is past Jan 2013. So you want to count all Notifications, which are not closed, but may show up in the future?
- Mark as New
- Bookmark
- Subscribe
- Mute
- Subscribe to RSS Feed
- Permalink
- Report Inappropriate Content
Hi
You are right…
It should of course be the notifications with notif.date in each month that are interesting.
In this case for January its 17 created and 15 closed notifications. For February its 23 created and 18 closed.
It’s that gap in percent I am interested in.
Best regards
/Mats
- Mark as New
- Bookmark
- Subscribe
- Mute
- Subscribe to RSS Feed
- Permalink
- Report Inappropriate Content
Still don't get how you calculate your numbers, I calculate
23 closed (status CLSD) and 28 total (23 + 5 with status IPRG) for month February.
- Mark as New
- Bookmark
- Subscribe
- Mute
- Subscribe to RSS Feed
- Permalink
- Report Inappropriate Content
Hi
Look at the pic. 23 in total for february. 18 CLSD, 5 IPRG
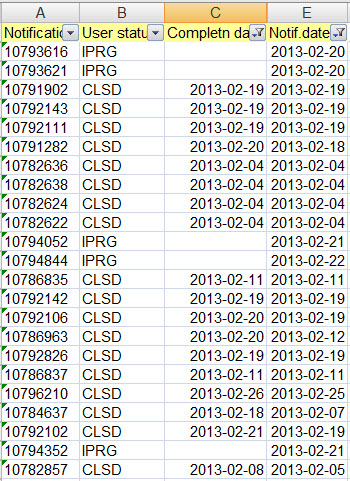
Notif.date and Completn date are both filtered for february.
/Mats
- Mark as New
- Bookmark
- Subscribe
- Mute
- Subscribe to RSS Feed
- Permalink
- Report Inappropriate Content
I am getting more and more confused.
So you don't want to count the 5 issues as CLOSED for month Feb 2013, that were created in December 2012 and Jan 2013?
Please compare with your number for CLOSED issues in your second post, where you required a number of 23 (now you are telling 18).
I don't have much more time too spend on this, sorry.
- « Previous Replies
-
- 1
- 2
- Next Replies »