Unlock a world of possibilities! Login now and discover the exclusive benefits awaiting you.
- Qlik Community
- :
- All Forums
- :
- QlikView App Dev
- :
- Simple Sum
- Subscribe to RSS Feed
- Mark Topic as New
- Mark Topic as Read
- Float this Topic for Current User
- Bookmark
- Subscribe
- Mute
- Printer Friendly Page
- Mark as New
- Bookmark
- Subscribe
- Mute
- Subscribe to RSS Feed
- Permalink
- Report Inappropriate Content
Simple Sum
sum({<feeddate={$(=addmonths(feeddate,-1))}>} total <[CSS Dimension]>TurnoverPopulationFlag)
I can't get the above expression to work. If I hardcode feeddate={'5/1/2011'}, it works. I've also tried using double quotes after looking at examples.
sum({<feeddate={"$(=addmonths(feeddate,-1))"}>} total <[CSS Dimension]>TurnoverPopulationFlag)
Can someone tell me what I'm doing wrong? Thanks!
- « Previous Replies
-
- 1
- 2
- Next Replies »
- Mark as New
- Bookmark
- Subscribe
- Mute
- Subscribe to RSS Feed
- Permalink
- Report Inappropriate Content
"You will only get a value when there is just one possible option, just like with the expression you're trying to include in your set analysis."
This statement is confusing. Why won't my expression change with changes in addmonths(feeddate,-1)? It clearly changes with the periods when written alone, but within the Sum it's not getting evaluated.
- Mark as New
- Bookmark
- Subscribe
- Mute
- Subscribe to RSS Feed
- Permalink
- Report Inappropriate Content
Whenever you're using $() you will only get one value. That's the way QV Works.
Seems like you need to do something else, if you let us know what it is that you need to do we might be able to help.
- Mark as New
- Bookmark
- Subscribe
- Mute
- Subscribe to RSS Feed
- Permalink
- Report Inappropriate Content
Daniel,
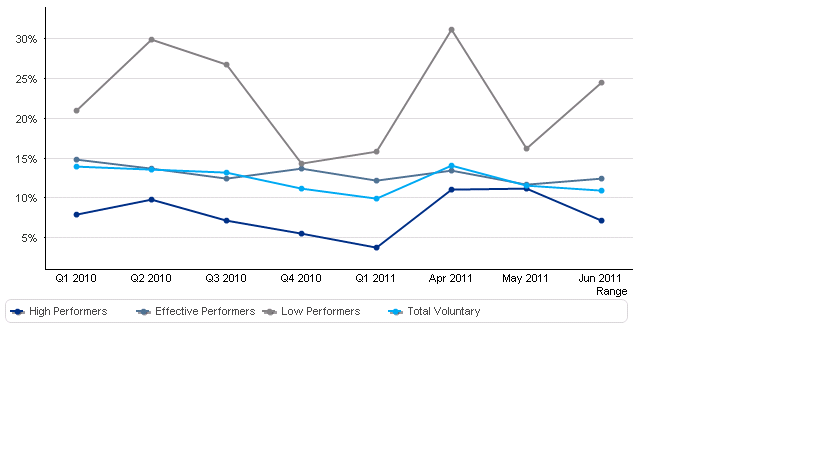
So one of my tasks is to update a line graph with the following Dimensions and Expressions:
Dimension: Range (values can be Q1 2010 through Q2 2011, Jan 2010 through Jun 2011)
Expressions: Annualized Vol Attrition Rates for High Performers, Effective Performers, Low Performers
(Sum ({<New_Rating={'High Performers'},
'$(iPossible)',
NEW_TERM_TYPE={'VOL_ATTRITION'}>}Terms)
/
(if((Range='YTD') or (Range='Prior YTD'),avgDiv,
if((Range like 'Q*') and (mod(num#(date(Max(feeddate),'M')),3)=0),((num#(date(Max(feeddate),'M')))/num(mid(Range,2,1))),
if((Range like 'Q*') and (mod(num#(date(Max(feeddate),'M')),3)<>0),(mod(num#(date(Max(feeddate),'M')),3)),avgDiv
))))*12)
/
if(SubStringCount('Jan.Feb.Mar.Apr.May.Jun.Jul.Aug.Sep.Oct.Nov.Dec',left(Range,3)) > 0,
(
(sum({<New_Rating={'High Performers'},
'$(iPossible)'
>}TurnoverPopulationFlag)
+
sum({<New_Rating={'High Performers'},
'$(iPossible)',
Month_Num={'(=Month_Num-1)'} //I'm unable to look back at the previous month. Is this possible?//feeddate={"$(=date(addmonths(feeddate,-1),'M/D/YYYY'))"} // another failed variation
//Range={"$(=date(addmonths(feeddate,-1),'MMM YYYY'))"} //yet another failed variation
>}TurnoverPopulationFlag)
)/2),(sum({<New_Rating={'High Performers'},
'$(iPossible)'
>}TurnoverPopulationFlag)
/
if((Range='YTD') or (Range='Prior YTD'),num#(date(Max(TOTAL feeddate),'M')),
if((Range like 'Q*') and (mod(num#(date(Max(feeddate),'M')),3)=0),(num#(date(Max(feeddate),'M')))/num(mid(Range,2,1)),
if((Range like 'Q*') and (mod(num#(date(Max(feeddate),'M')),3)<>0),mod(num#(date(Max(feeddate),'M')),3),avgDiv
))))
)
Based on the Expression above, my Quarterly numbers are correct. However, my Monthly numbers are incorrect, because I'm unable to look back at the previous month to do this calculation - (current headcount + prior headcount)/2
The underlying table and the line chart currently look like this. Is what I'm trying to do even possible? Thanks in advance.
Range High Performers Effective Performers Low Performers Total Voluntary Q1 2010 7.97% 14.8% 21.0% 13.9% Q2 2010 9.75% 13.7% 29.9% 13.6% Q3 2010 7.23% 12.4% 26.7% 13.2% Q4 2010 5.57% 13.7% 14.3% 11.2% Q1 2011 3.76% 12.2% 15.9% 10.0% Apr 2011 11.11% 13.5% 31.2% 14.1% May 2011 11.24% 11.7% 16.2% 11.6% Jun 2011 7.16% 12.4% 24.5% 11.0%
- Mark as New
- Bookmark
- Subscribe
- Mute
- Subscribe to RSS Feed
- Permalink
- Report Inappropriate Content
You should consider working on trying to simplify your expression as it is almost impossible to follow through.
- Mark as New
- Bookmark
- Subscribe
- Mute
- Subscribe to RSS Feed
- Permalink
- Report Inappropriate Content
Sorry for uploading that "crazy" code. Anyway, here is the issue I need to figure out. I have periods set up through a Range field that includes quarters Q1 2010 through Q2 2011 and months Jan 2010 through Jun 2011. The client wants the line graph to display quarters Q1 2010 through Q1 2011 followed by the months in the current quarter (Apr 2011, May 2011, and Jun 2011). This all currently works fine today as none of my calculations involve looking at prior months.
Now the calculation for monthly (in this case, Apr 2011, May 2011, Jun 2011) annualized attrition needs average headcount as part of the expression. Average headcount is defined as (current HC + prior HC)/2.
I'm able to do this using the AsOf technique, as described numerous times on the forums, if the line chart is strictly month over month. However, I need to show quarters AND months in the same graph. So my dilemma is preserving my Quarterly and Monthly range intervals, but for the months, I need to be able to get prior month data. Any ideas?
- « Previous Replies
-
- 1
- 2
- Next Replies »