Unlock a world of possibilities! Login now and discover the exclusive benefits awaiting you.
- Qlik Community
- :
- All Forums
- :
- QlikView App Dev
- :
- Simple expression
- Subscribe to RSS Feed
- Mark Topic as New
- Mark Topic as Read
- Float this Topic for Current User
- Bookmark
- Subscribe
- Mute
- Printer Friendly Page
- Mark as New
- Bookmark
- Subscribe
- Mute
- Subscribe to RSS Feed
- Permalink
- Report Inappropriate Content
Simple expression
I have a data table:
| Date | Point | Value |
| 2016.05.05 | AAA | 1 |
| 2016.05.05 | AAA | 1 |
| 2016.05.05 | BBB | 2 |
| 2016.05.05 | BBB | 2 |
| 2016.05.06 | AAA | 1 |
| 2016.05.06 | BBB | 2 |
The result I am look for is a unique number of points every single day.
I wish to get the result as a Pivot Table.
The result should look like this:
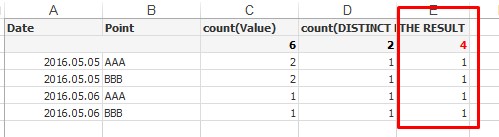
Thank you!
- Tags:
- count
Accepted Solutions
- Mark as New
- Bookmark
- Subscribe
- Mute
- Subscribe to RSS Feed
- Permalink
- Report Inappropriate Content
If you are after the combination of your dimensions, you can also use
Count(DISTINCT Point&Date)
avoiding the overhead of advanced aggregation completely.
- Mark as New
- Bookmark
- Subscribe
- Mute
- Subscribe to RSS Feed
- Permalink
- Report Inappropriate Content
How about this?
Sum(Aggr(Count(DISTINCT Point), Date, Point))
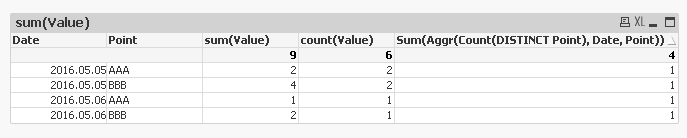
Update: Not sure if you want distinct count of value or Point. If it is value, then may be this:
Sum(Aggr(Count(DISTINCT Value), Date, Point))
The reason both worked in this case was because they were always same, but if they might not be the same for a particular day, then you need to choose between distinct count of value vs distinct count of point.
Best,
Sunny
- Mark as New
- Bookmark
- Subscribe
- Mute
- Subscribe to RSS Feed
- Permalink
- Report Inappropriate Content
Maybe
=Sum( Aggr( Count(DISTINCT Value), Date, Point))
- Mark as New
- Bookmark
- Subscribe
- Mute
- Subscribe to RSS Feed
- Permalink
- Report Inappropriate Content
Hi,
Yes, you can handle this in Expression.
But if the group by condition is static and doesn't change very frequently, better create a key field with date and Point in fact table and for the same create a separate table with load the distinct record of Key and add 1 as a value field.
In expression, you can use Sum(Value)
Regards,
Srini.
- Mark as New
- Bookmark
- Subscribe
- Mute
- Subscribe to RSS Feed
- Permalink
- Report Inappropriate Content
If you are after the combination of your dimensions, you can also use
Count(DISTINCT Point&Date)
avoiding the overhead of advanced aggregation completely.