Unlock a world of possibilities! Login now and discover the exclusive benefits awaiting you.
- Qlik Community
- :
- All Forums
- :
- QlikView App Dev
- :
- Re: Simulate Left Join in (say) Straight Table
- Subscribe to RSS Feed
- Mark Topic as New
- Mark Topic as Read
- Float this Topic for Current User
- Bookmark
- Subscribe
- Mute
- Printer Friendly Page
- Mark as New
- Bookmark
- Subscribe
- Mute
- Subscribe to RSS Feed
- Permalink
- Report Inappropriate Content
Simulate Left Join in (say) Straight Table
Hi
Haven't used QlikView for a while so struggling a bit to help out a colleague. I have a cut down test load script thus:
load * inline [CustomerID, CustomerCode, IsA, IsB
1,C1,Yes,No
2,C2,Yes,Yes
3,C3,No,No];
load * inline [ContactID, ContactName, CustomerID, IsX, IsY
1,Fred,1,No,Yes
2,Freda,1,No,No
3,Jane,2,Yes,No];
Sheet has simple list boxes for selecting on IsA, IsB, IsX and IsY. I need some form of table that can be exported to Excel and shows:
- All contacts, together with their customer data, that are selected by IsA, IsB, IsX and IsY.
- All customers selected by IsA and IsB.
Briefly, I need the equivalent of an SQL outer join so I get all customers selected by the customer level filters plus all contacts selected by the contact level filters. All criteria/logic must be in simultaneously applied to a single table. I wanted to avoid doing an outer join in the load script because the population should reflect the interactive list box settings. Is there some sort of set analysis that I can use? It seems so simple but am getting nowhere. Am I missing something obvious?
Any help would be much appreciated. Many thanks.
Bredon
- Tags:
- left
- new_to_qlikview
- Mark as New
- Bookmark
- Subscribe
- Mute
- Subscribe to RSS Feed
- Permalink
- Report Inappropriate Content
Bredon - Can you provide the sample expected output for your two bullets above? I'm trying to visualize what you are trying to get at. Thanks!
- Mark as New
- Bookmark
- Subscribe
- Mute
- Subscribe to RSS Feed
- Permalink
- Report Inappropriate Content
Hi,
Try with Concatenate function in this situation.
But I think that you'll have problem in your database model in the future because you use field which isn't with unique values for key field.
So you have to fix this problem. You can add additional field with unique values or add additional field in the table files, for example: New column with values 1,2,3 .... .. n .
Regards,
Venelin
- Mark as New
- Bookmark
- Subscribe
- Mute
- Subscribe to RSS Feed
- Permalink
- Report Inappropriate Content
Hello Bredon,
If I'm interpreting your description correctly, the only thing you need to do is create a 'Table' object and place all the fields from Customers and Contacts into it.
Because you used the identical field name [CustomerID] in both tables, this automatically becomes your keyfield, and during script execution it creates an association between them, which is essentially your full outer join. Now after script completion, when the end-user makes selections through the user interface in the IsA, IsB, IsX, IsY fields, the Table object will reduce its row contents dynamically and no special formulas or coding is needed, this is just an out of the box feature of QlikView.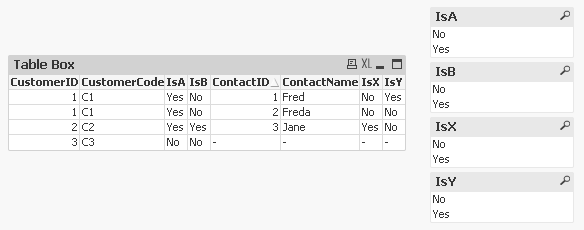
- Mark as New
- Bookmark
- Subscribe
- Mute
- Subscribe to RSS Feed
- Permalink
- Report Inappropriate Content
Hi Evan
You have a constructed a sheet just like mine! The problem is that I don't see how to set IsY = Yes (selecting Fred) and (simultaneously) IsB = Yes ( selecting just C2 but not Jane). My list boxes behave like ANDs; My colleague needs an OR. She wants to see Fred (and by implication C1) together with C2 in the Table Box at the same time.
Is there something in the user interface that I am missing? I have very little QV experience and haven't used it recently. My colleague is working from two Excel spread sheets. I have typically worked QV on top of a star schema. Though I have made QV work on just one spreadsheet, I have always had problems with two.
Given we have not committed to purchasing QV yet, is what we need to do easier in QlikSense? (My colleague is working with the personal edition to see if it would do what she needs. If she can then it helps build the case for purchase. I need to empower her so she can produce her own solutions.)
Thanks to you all for taking the time and trouble to respond to me.
Thanks
Bredon
- Mark as New
- Bookmark
- Subscribe
- Mute
- Subscribe to RSS Feed
- Permalink
- Report Inappropriate Content
Hello All
I have rearranged the load script so I can get what is required:
load * inline [SchoolCode, SchoolAddress,IsPrimarySchool, IsSecondarySchool, ContactName, FrenchContactStatus,GermanContactStatus
C1,Perth,Yes,No,NotApplicable,SchoolWithNoFrenchContact,SchoolWithGermanContact
C1,Perth,Yes,No,Fred,NotFrenchContact,GermanContact
C1,Perth,Yes,No,Freda,NotFrenchContact,NotGermanContact
C2,Glasgow,Yes,Yes,NotApplicable,SchoolWithFrenchContact,SchoolWithNoGermanContact
C2,Glasgow,No,No,Jane,FrenchContact,NotGermanContact
C3,York,No,No,NotApplicable,SchoolWithNoFrenchContact,SchoolWithNoGermanContact];
This gives me a sheet like:
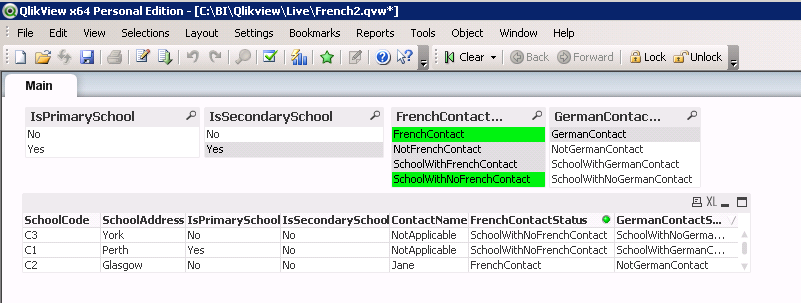
Is it necessary to load the data is this format to achieve this result? If not, how do I go about it. If the data does need to be manipulated in to this format, then how would I set the 'SchoolWithNoFrenchContact','SchoolWithFrenchContact' etc values within a load script than runs from spreadsheets. (I can do it in SQL...)
Does this make sense? Many thanks.
Bredon
- Mark as New
- Bookmark
- Subscribe
- Mute
- Subscribe to RSS Feed
- Permalink
- Report Inappropriate Content
Hello Bredon,
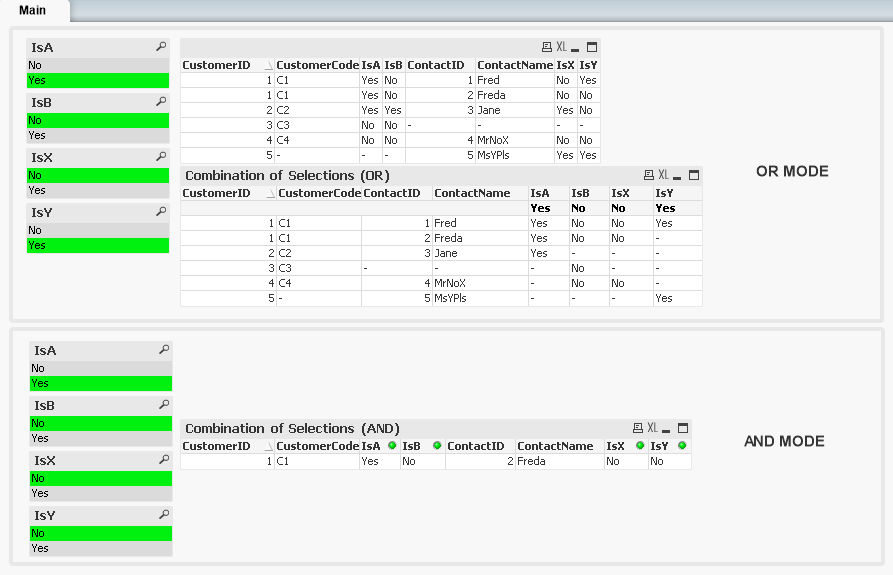
I put together a sample app that will give you two sets of selectors side-by-side and one will produce the traditional out of box AND mode of applying selections, and then I added a set of controls which will produce the OR type of behavior you describe.
With regards to finding the right solution for your Qlik needs, you should contact Qlik and I'm sure you can get good advice from both sales and technical staff on what would be the best solution for your organization. If you need any references I can offer some contacts.
- Mark as New
- Bookmark
- Subscribe
- Mute
- Subscribe to RSS Feed
- Permalink
- Report Inappropriate Content
Thanks to everyone for your help with this. At this stage, it is just a proof of concept and we do now have a way forward. Thanks again. Bredon.