Unlock a world of possibilities! Login now and discover the exclusive benefits awaiting you.
- Qlik Community
- :
- All Forums
- :
- QlikView App Dev
- :
- Smallest 3 in Dimension
- Subscribe to RSS Feed
- Mark Topic as New
- Mark Topic as Read
- Float this Topic for Current User
- Bookmark
- Subscribe
- Mute
- Printer Friendly Page
- Mark as New
- Bookmark
- Subscribe
- Mute
- Subscribe to RSS Feed
- Permalink
- Report Inappropriate Content
Smallest 3 in Dimension
Hello. Please see attached. I have a bar chart of items and profit margins. My dimension limit is set to show the smallest 3 values (three lowest profit margins). But only one value appears. I know it has to do with my expression which calculates a percentage (1 - (sum(Sales) / sum(Margin)); some of the sales and margin values are zero. I tried some set analyses to filter them out, but I must be overlooking something. As a result, it seems to be applying placeholders for those items for which it can't calculate a profit margin. What's the most efficient way of ignoring these items? Thanks.
- Mark as New
- Bookmark
- Subscribe
- Mute
- Subscribe to RSS Feed
- Permalink
- Report Inappropriate Content
For smallest 3 try Rank function some thing like below mention expression
if( Rank(1 - (Sum(Sales) / Sum(Margin))) <= 3, 1 - (Sum(Sales) / Sum(Margin)) )
Note:- And remove Dimension Limits settings.
Regards
Anand
- Mark as New
- Bookmark
- Subscribe
- Mute
- Subscribe to RSS Feed
- Permalink
- Report Inappropriate Content
You just see one value, because your 3 minors include X and Z equal to zero. If you want to see in the graph go to the properties and in presentation tab unmark "Suppress Zero-Values"
- Mark as New
- Bookmark
- Subscribe
- Mute
- Subscribe to RSS Feed
- Permalink
- Report Inappropriate Content
Thanks. But I do want to suppress them -- the issue is I don't want them included in the ranking at all. The next two "unsuppressed" values should appear in my chart.
- Mark as New
- Bookmark
- Subscribe
- Mute
- Subscribe to RSS Feed
- Permalink
- Report Inappropriate Content
What are Top 3 values to be display in the chart please let me know with the values, I suggest you have to use Rank function for this with this expression.
if( Rank(1 - (Sum(Sales) / Sum(Margin))) <= 3, 1 - (Sum(Sales) / Sum(Margin)) )
Regards
Anand
- Mark as New
- Bookmark
- Subscribe
- Mute
- Subscribe to RSS Feed
- Permalink
- Report Inappropriate Content
In this case you need to create an expression for that. Remember that this dimension limits works over you data as is, for this case, reject zero values and evaluates the others.
You can use the expresion above to suppress zero values.
- Mark as New
- Bookmark
- Subscribe
- Mute
- Subscribe to RSS Feed
- Permalink
- Report Inappropriate Content
Thanks. I've applied this to my larger (application) data set, and it returns unexpected results. It does eliminate the NULL values, but the values displayed aren't correct. I'm still investigating...
- Mark as New
- Bookmark
- Subscribe
- Mute
- Subscribe to RSS Feed
- Permalink
- Report Inappropriate Content
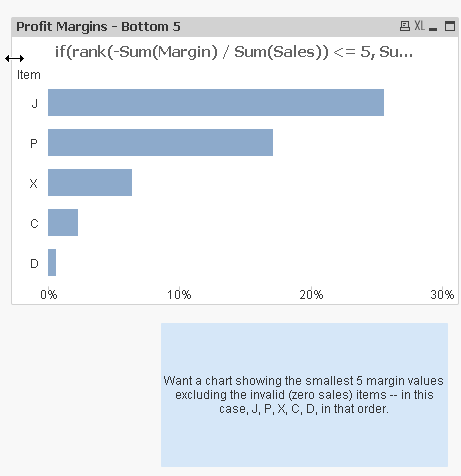
See attached. That expression isn't working. I thought Rank() might take a parameter that sorted the values in descending order then took the top 5 (which would be the bottom 5), but that doesn't seem to be the case either. I simplified my example somewhat, and added more values.
- Mark as New
- Bookmark
- Subscribe
- Mute
- Subscribe to RSS Feed
- Permalink
- Report Inappropriate Content
- Mark as New
- Bookmark
- Subscribe
- Mute
- Subscribe to RSS Feed
- Permalink
- Report Inappropriate Content
A belated thank you for this. It does work, although it doesn't handle zero values very well. So in the case that my five lowest margins are -10%, -7%, -5%, -2% and 0%, it only shows the four non-zero values. Perhaps it has something to do with supressing zero values, but unchecking it didn't quite fix it. It's a rare enough occurrence with our data set that I might just live with it.