Unlock a world of possibilities! Login now and discover the exclusive benefits awaiting you.
- Qlik Community
- :
- All Forums
- :
- QlikView App Dev
- :
- Re: Solution for Stacked bar chart with target ref...
- Subscribe to RSS Feed
- Mark Topic as New
- Mark Topic as Read
- Float this Topic for Current User
- Bookmark
- Subscribe
- Mute
- Printer Friendly Page
- Mark as New
- Bookmark
- Subscribe
- Mute
- Subscribe to RSS Feed
- Permalink
- Report Inappropriate Content
Solution for Stacked bar chart with target references for each individual bar
Hello, I am trying to determine the best solution for a use case. I am trying to create a stacked bar chart that has a pass/fail for each bar and two reference lines / high and low target lines for each individual bar. Currently you can only define one reference line not two. I have attached a mock-up of what I am trying to achieve. Can someone give me some ideas of how best to achieve this visualization? T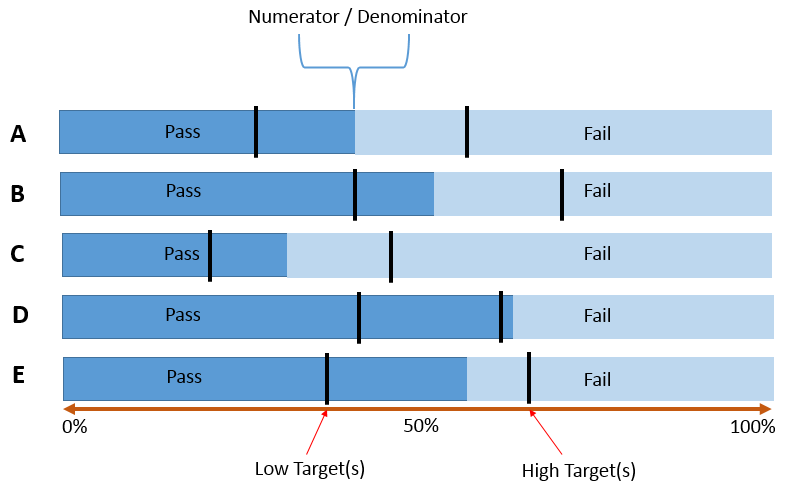
Thanks!
- Mark as New
- Bookmark
- Subscribe
- Mute
- Subscribe to RSS Feed
- Permalink
- Report Inappropriate Content
If your chart is quite static you could try to use a background-image for your low/high targets. If not you will be need two/several charts which are laying over eachother to get the stacked bar and the targets as a symbol. The description of pass/fail could you get with a dual(string, numeric vale) and for your arrow-axis you will need an arrow-object.
- Marcus
- Mark as New
- Bookmark
- Subscribe
- Mute
- Subscribe to RSS Feed
- Permalink
- Report Inappropriate Content
I am trying to achieve something similar using box plot.
Does anyone have other ideas?
- Mark as New
- Bookmark
- Subscribe
- Mute
- Subscribe to RSS Feed
- Permalink
- Report Inappropriate Content
Hi @atair , this is the closest thing that i can do, its going to depend on your tables structure, so as an example, i created a simple data table. Please check the .qvw file attached.

did it work for you? give like and mark the solution as accepted.
- Mark as New
- Bookmark
- Subscribe
- Mute
- Subscribe to RSS Feed
- Permalink
- Report Inappropriate Content
Thanks @QFabian . That covers all the expected measurements.
I wish @Anonymous would allow customized Symbols or Lines for this.