Unlock a world of possibilities! Login now and discover the exclusive benefits awaiting you.
- Qlik Community
- :
- All Forums
- :
- QlikView App Dev
- :
- Re: Sort second dimension by expression with aggr ...
- Subscribe to RSS Feed
- Mark Topic as New
- Mark Topic as Read
- Float this Topic for Current User
- Bookmark
- Subscribe
- Mute
- Printer Friendly Page
- Mark as New
- Bookmark
- Subscribe
- Mute
- Subscribe to RSS Feed
- Permalink
- Report Inappropriate Content
Sort second dimension by expression with aggr in a mixed graph (bars and lines)
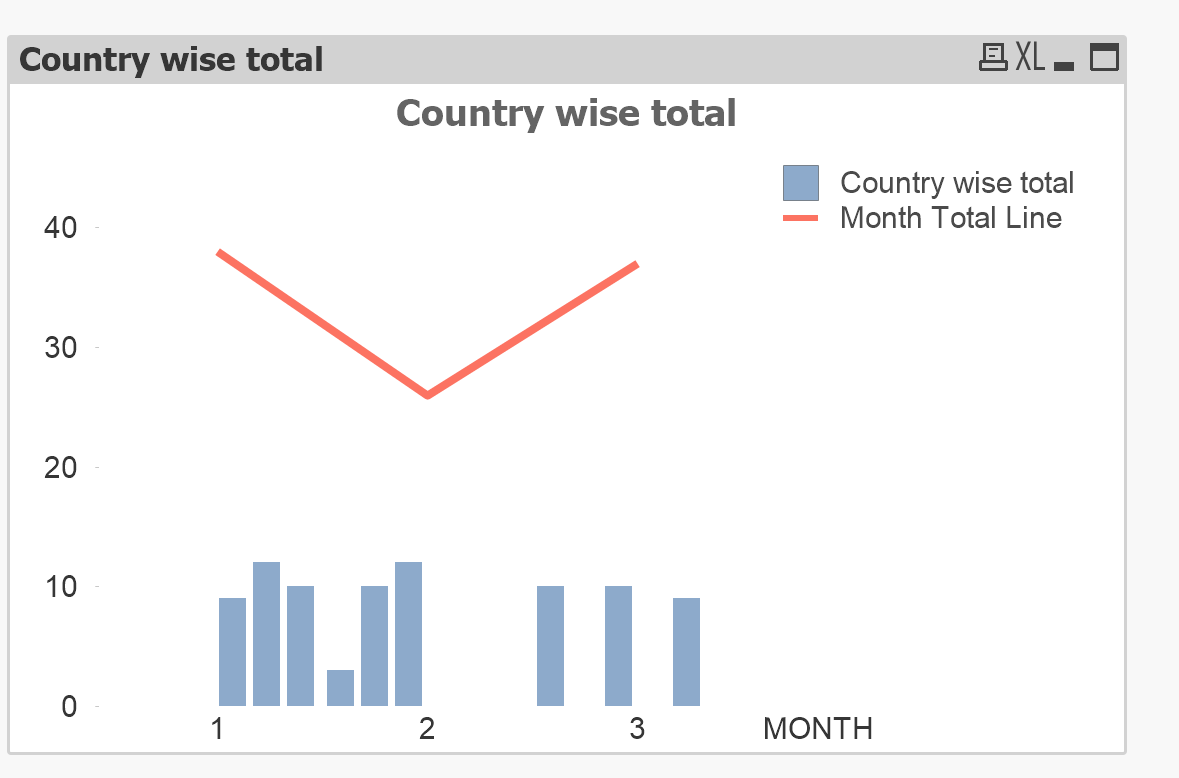
Good morning, I wanted to raise a problem that I have when creating a mixed graphic (bars and lines) where I want to sort by a dimension, showing only the 3 highest values within each month.
Suppose we have the following data:
LOAD * INLINE
[
MONTH
1
2
3
];
LOAD * INLINE
[
COUNTRY
FRANCE
GERMANY
SPAIN
UNITED KINGDOM
BRAZIL
PORTUGAL
];
LOAD * INLINE
[
MONTH,COUNTRY,TOTAL
1,FRANCE,10
1,SPAIN,5
1,GERMANY,12
1,UNITED KINGDOM,9
1,PORTUGAL,2
2,PORTUGAL, 12
2,BRAZIL, 10
2,GERMANY, 1
2,SPAIN, 3
3,SPAIN,10
3,UNITED KINGDOM, 8
3,GERMANY, 9
3,PORTUGAL, 10
];
And I want to draw in a graph, with lines the total sales per month and bars the 3 countries that have more sales in each month.
Attachment of Qlik View file
- Mark as New
- Bookmark
- Subscribe
- Mute
- Subscribe to RSS Feed
- Permalink
- Report Inappropriate Content
Not having access to qvw but may be something like this -