Unlock a world of possibilities! Login now and discover the exclusive benefits awaiting you.
- Qlik Community
- :
- All Forums
- :
- QlikView App Dev
- :
- Sorting Stacked Chart
- Subscribe to RSS Feed
- Mark Topic as New
- Mark Topic as Read
- Float this Topic for Current User
- Bookmark
- Subscribe
- Mute
- Printer Friendly Page
- Mark as New
- Bookmark
- Subscribe
- Mute
- Subscribe to RSS Feed
- Permalink
- Report Inappropriate Content
Sorting Stacked Chart
I have a chart with the following Dimensions:
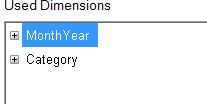
My Expression is:
Sum(FreightCosts)
My graph looks like:
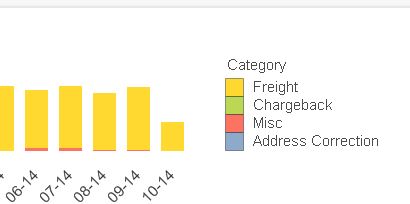
I want it to sort the lowest value on top (Misc) and Highest on bottom (Freight). I have tried everything and can't get it to work.
Please help.
Accepted Solutions
- Mark as New
- Bookmark
- Subscribe
- Mute
- Subscribe to RSS Feed
- Permalink
- Report Inappropriate Content
Hi Amanda,
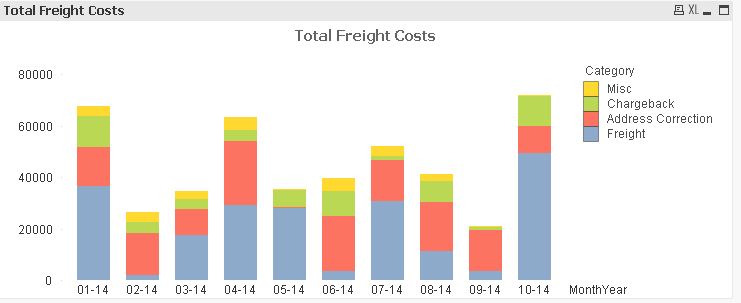
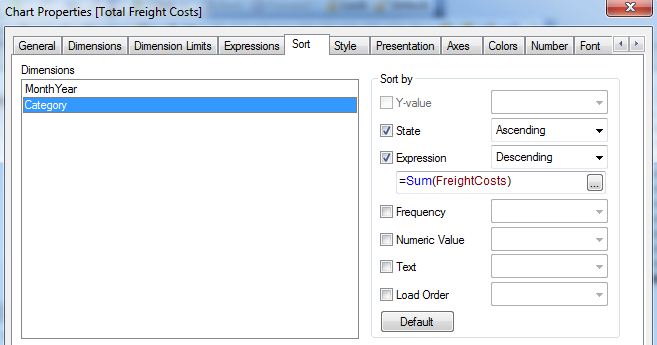
one solution might be to use Sum(FreightCosts) as a sorting expression as well. The order can be defined once for the whole chart, not per bar though, i.e. the order is defined by the total costs per category:

hope this helps
regards
Marco
- Mark as New
- Bookmark
- Subscribe
- Mute
- Subscribe to RSS Feed
- Permalink
- Report Inappropriate Content
Hi Amanda,
one solution might be to use Sum(FreightCosts) as a sorting expression as well. The order can be defined once for the whole chart, not per bar though, i.e. the order is defined by the total costs per category:


hope this helps
regards
Marco
- Mark as New
- Bookmark
- Subscribe
- Mute
- Subscribe to RSS Feed
- Permalink
- Report Inappropriate Content
The SUM Freight function still isn't working. Here is what it looks like now:
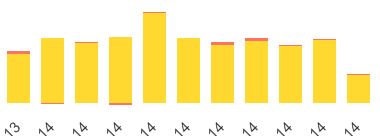
The Red section (Misc) is now all over the place.
- Mark as New
- Bookmark
- Subscribe
- Mute
- Subscribe to RSS Feed
- Permalink
- Report Inappropriate Content
Hi go to sort tab and select sort by y value ascending for both dimensions.
Regards
ASHFAQ
- Mark as New
- Bookmark
- Subscribe
- Mute
- Subscribe to RSS Feed
- Permalink
- Report Inappropriate Content
Hi Amanda,
Try using =Rank(Sum(FreightCosts)) for the expression for Category in the sort tab and set to Ascending.
- Mark as New
- Bookmark
- Subscribe
- Mute
- Subscribe to RSS Feed
- Permalink
- Report Inappropriate Content
Okay... so the Sum(FreightCosts) is actually working. I reviewed my data, and apparently some of my freight (misc) is negative.
SO, it is sorting correctly!
Thanks All.
Amanda
- Mark as New
- Bookmark
- Subscribe
- Mute
- Subscribe to RSS Feed
- Permalink
- Report Inappropriate Content
Amanda i see that you are new here so please take the time to mark Marco's answer as correct answer