Unlock a world of possibilities! Login now and discover the exclusive benefits awaiting you.
- Qlik Community
- :
- All Forums
- :
- QlikView App Dev
- :
- Re: Sorting data based on 2 expressions (in a char...
- Subscribe to RSS Feed
- Mark Topic as New
- Mark Topic as Read
- Float this Topic for Current User
- Bookmark
- Subscribe
- Mute
- Printer Friendly Page
- Mark as New
- Bookmark
- Subscribe
- Mute
- Subscribe to RSS Feed
- Permalink
- Report Inappropriate Content
Sorting data based on 2 expressions (in a chart)
Hi all,
I currently have a set of data like this:
| Value | Journal ID | User |
|---|---|---|
| 100 | 1 | isaac |
| 200 | 4 | isaac |
| 250 | 3 | isaac |
| 50 | 2 | joseph |
| 10 | 5 | joseph |
| 13 | 8 | luke |
| 12 | 9 | mary |
| 50 | 10 | miranda |
My aim is to create a chart with:
1 dimension (User)
and 2 expressions (sum of value) and count(distinct Journal ID) for each user.
I manage to create a chart just fine ( an example of this is attached) . However i'm having difficulty sorting the cart, I would like to sort the chart based on High value and low volume.
Does anyone know If I can achieve this?
Thanks
Accepted Solutions
- Mark as New
- Bookmark
- Subscribe
- Mute
- Subscribe to RSS Feed
- Permalink
- Report Inappropriate Content
- Mark as New
- Bookmark
- Subscribe
- Mute
- Subscribe to RSS Feed
- Permalink
- Report Inappropriate Content
hi
can you be more specific , how can you combine the two measures
my only thought is you can use rank for both measures and take sort according to the sum of the two ranks
for example rank(sum(value))+rank(-count(distinct Journal ID) )
this way you get low ranks if you have high value low volume
- Mark as New
- Bookmark
- Subscribe
- Mute
- Subscribe to RSS Feed
- Permalink
- Report Inappropriate Content
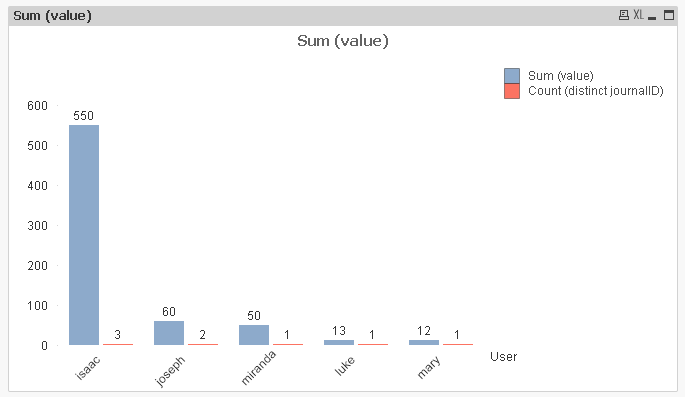
Hi
do you want some thing like this
- Mark as New
- Bookmark
- Subscribe
- Mute
- Subscribe to RSS Feed
- Permalink
- Report Inappropriate Content
what is your expected sorted value????
Regards,
Please appreciate our Qlik community members by giving Kudos for sharing their time for your query. If your query is answered, please mark the topic as resolved 🙂
- Mark as New
- Bookmark
- Subscribe
- Mute
- Subscribe to RSS Feed
- Permalink
- Report Inappropriate Content
Hi Vishweshwari,
Yes please that's exactly what I am trying to achieve
- Mark as New
- Bookmark
- Subscribe
- Mute
- Subscribe to RSS Feed
- Permalink
- Report Inappropriate Content
In that case you can sort it like property > sort > sort by Y-Value - > Descending.
Regards,
Please appreciate our Qlik community members by giving Kudos for sharing their time for your query. If your query is answered, please mark the topic as resolved 🙂
- Mark as New
- Bookmark
- Subscribe
- Mute
- Subscribe to RSS Feed
- Permalink
- Report Inappropriate Content
ok
kindly find the attachment.
- Mark as New
- Bookmark
- Subscribe
- Mute
- Subscribe to RSS Feed
- Permalink
- Report Inappropriate Content
May be this:
Sum(Aggr(Count(Distinct JournalID),User,Value))
- Mark as New
- Bookmark
- Subscribe
- Mute
- Subscribe to RSS Feed
- Permalink
- Report Inappropriate Content
Thank you Vishweshwari,
Did you just sort by state and expression sum(value)?
I can see how it works perfectly on the dashboard you kindly provided but doesn't work on my dashboard. I don't know if i'm missing something or if I need to re-load my data and force the Journal ID to be numeric
Thanks,
Isaac