Unlock a world of possibilities! Login now and discover the exclusive benefits awaiting you.
- Qlik Community
- :
- All Forums
- :
- QlikView App Dev
- :
- Re: Sorting in charts
- Subscribe to RSS Feed
- Mark Topic as New
- Mark Topic as Read
- Float this Topic for Current User
- Bookmark
- Subscribe
- Mute
- Printer Friendly Page
- Mark as New
- Bookmark
- Subscribe
- Mute
- Subscribe to RSS Feed
- Permalink
- Report Inappropriate Content
Sorting in charts
I have a below table
Account Product investor value
12343 Abcd Sam 20000
12322 Abbcd Bob 40000
12333 asdf Jack 34234
12344 Abcd Roger 234543
I just want to plot a bar chart accounts with the top 5 values. I was able to create the chart with Account as the dimension and value in the expression. I wanted to display only the top 5 values, so in the dimension limitation, I limited to the largest 5.
The display in the chart I get the top 5 account numbers and the corresponding values. The chart needs to be sorted in the value but it gets sorted on the account number.
Can someone help me get this chart sorted in values? I need this chart sorted in the expression field.
- Mark as New
- Bookmark
- Subscribe
- Mute
- Subscribe to RSS Feed
- Permalink
- Report Inappropriate Content
Hi,
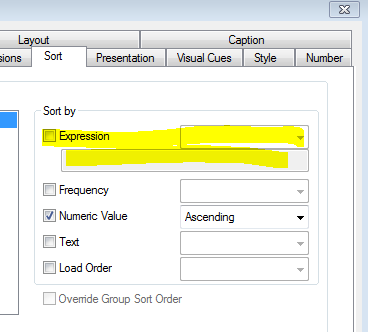
Uncheck all options for the Account Dimension in Sort Tab. Check the Sort By Expression option and add your expression to sort.
- Mark as New
- Bookmark
- Subscribe
- Mute
- Subscribe to RSS Feed
- Permalink
- Report Inappropriate Content
the Expression i have used is money(value) .
It doesnt work with the sort by expression.
- Mark as New
- Bookmark
- Subscribe
- Mute
- Subscribe to RSS Feed
- Permalink
- Report Inappropriate Content
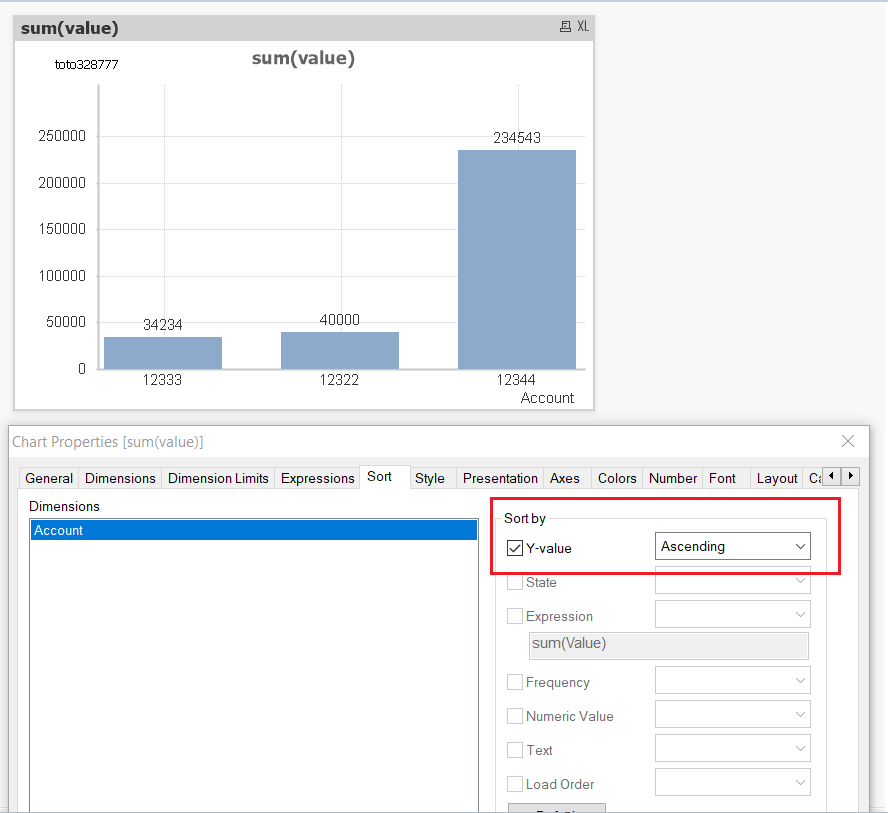
Try with sort by Y value :
- Mark as New
- Bookmark
- Subscribe
- Mute
- Subscribe to RSS Feed
- Permalink
- Report Inappropriate Content
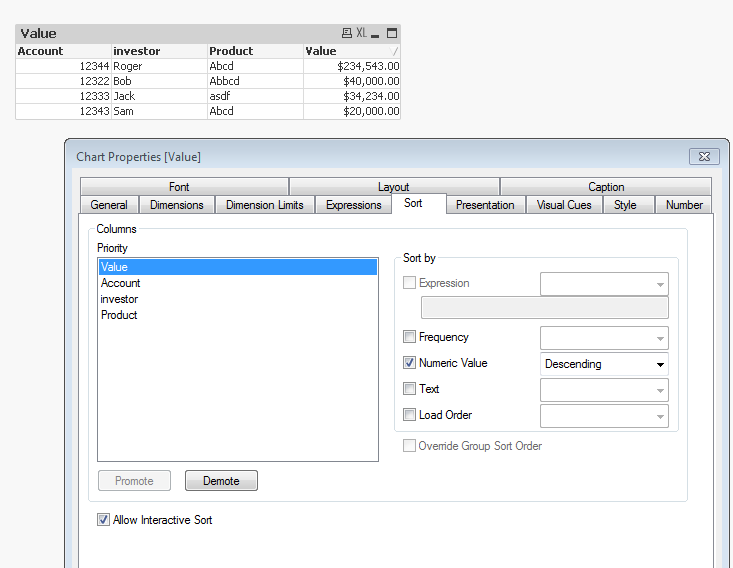 Hope the Attached file helps you.
- Mark as New
- Bookmark
- Subscribe
- Mute
- Subscribe to RSS Feed
- Permalink
- Report Inappropriate Content
I missed some data, the sorting works when there is one record for each account when there is more than one record the sorting does not work.
Account | Product | investor | value |
12343 | Abcd | Sam | 5000 |
12335 | Abbcd | Bob | 24003 |
12321 | asdf | Jack | 2142 |
12342 | Abcd | Roger | 12426 |
12343 | Abbcd | Sam | 80020 |
12343 | asdf | Sam | 400 |
Please find the data above. I tried using the max(value) in the expression but that does not give the top 5 values in the chart.
Want the chart to show the top 5 values and its corresponding Account numbers irrespective of the repeated account numbers
- Mark as New
- Bookmark
- Subscribe
- Mute
- Subscribe to RSS Feed
- Permalink
- Report Inappropriate Content
In Expression you have used Max function, which filters your second value for same value. in Chart the dimension will be aggregated based on you expression.
- Mark as New
- Bookmark
- Subscribe
- Mute
- Subscribe to RSS Feed
- Permalink
- Report Inappropriate Content
Yes, I need an expression instead of it to display the chart showing the top values and respective account even if the account has two top values it should display in the chart
Can you please help on that ?