Unlock a world of possibilities! Login now and discover the exclusive benefits awaiting you.
- Qlik Community
- :
- All Forums
- :
- QlikView App Dev
- :
- Re: Sorting issue in chart, driving me loopy!!
- Subscribe to RSS Feed
- Mark Topic as New
- Mark Topic as Read
- Float this Topic for Current User
- Bookmark
- Subscribe
- Mute
- Printer Friendly Page
- Mark as New
- Bookmark
- Subscribe
- Mute
- Subscribe to RSS Feed
- Permalink
- Report Inappropriate Content
Sorting issue in chart, driving me loopy!!
Hi
I have a line chart that depicts last 12 months spend based on the month and year you click on, with the last 12 months spend for the preceding 2 years also showing.
We have a field called Cal_MonthDiff which contains a numerical value comparing the current month to each the month of each record in the dataset. So for example July 2014 records are set as 0, June 2014 are set as -1, June 2013 is -13 etc. There is also a field called CalMonth which is the alpha values for the month, Jan, Feb, Mar etc.
My chart uses CalMonth as the dimension, and has 3 expressions
L12M: Sum( {1<Cal_MonthDiff = {">=$(vLTMStart)<=$(vLTMEnd)"}>} TURNOVER_NET )
L12M-1: Sum( {1<Cal_MonthDiff = {">=$(vLTM-1Start)<=$(vLTM-1End)"}>} TURNOVER_NET )
L12M-2: Sum( {1<Cal_MonthDiff = {">=$(vLTM-2Start)<=$(vLTM-2End)"}>} TURNOVER_NET )
This then plots the 3 years worth of values for each month on the chart, and the values all appear to be correct.
The problem lies in the sorting of the chart. I thought that if I sorted the chart by an Expression and entered Cal_MonthDiff sorted Ascending it would show the months in reverse order with the month you selected showing at the far right of the axis. So for example if you selected June 2014, July would show on the left followed by the other months in order leading up to June on the far right. However, what is happening is that the month selected is appearing on the far left, followed by the other months in order, e.g. Jun, Jan, Feb, Mar, Apr, May, Jul, Aug, etc...
Whichever month I select it reorders the chart, even though I have Cal_MonthDiff as the sort order.
Is there any way to stop this happening??
Many thanks
- Mark as New
- Bookmark
- Subscribe
- Mute
- Subscribe to RSS Feed
- Permalink
- Report Inappropriate Content
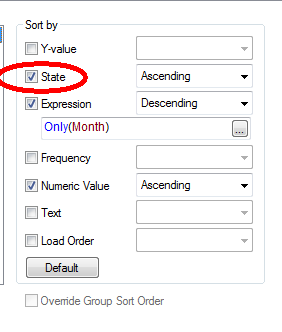
I suspect you have "Sort by State" on. Turn this off and it will probably work.
HIC