Unlock a world of possibilities! Login now and discover the exclusive benefits awaiting you.
- Qlik Community
- :
- All Forums
- :
- QlikView App Dev
- :
- Re: Sorting on trend chart not proper.......[trend...
- Subscribe to RSS Feed
- Mark Topic as New
- Mark Topic as Read
- Float this Topic for Current User
- Bookmark
- Subscribe
- Mute
- Printer Friendly Page
- Mark as New
- Bookmark
- Subscribe
- Mute
- Subscribe to RSS Feed
- Permalink
- Report Inappropriate Content
Sorting on trend chart not proper.......[trend chart has 1 invisible expression..]
Hi All,
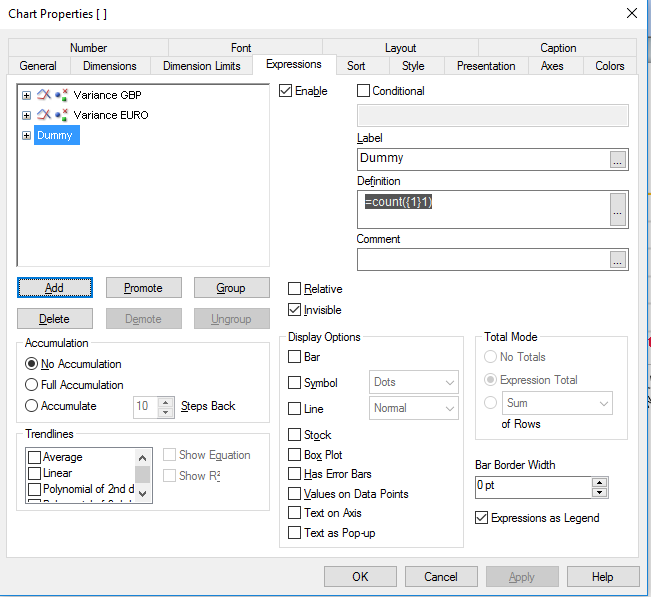
I want to achieve 52 week tred chart [ even though data is available only for selected weeks during year]. To achieve this I have used following
My dimension is : ='Week '&WkNbr -----where WkNbr has numeric values
My Expression is := Num
(
(
sum({1}RawMaterialActVolBudPriceAmtGBP)
-
sum({1}RawMaterialStdVolBudPriceAmtGBP)
)/1000
,'£#,##0K;(£#,##0K)'
)
And to get 52 weeks for missing values I have used Dummy Invisible expression =count({1}1)

Although I Got the desired result, I am facing problem with sorting the X axis. Please refer below image , it is starting from week 2 and getting week 1 at the end.

Tried all sorting options but not getting desired value. Any help is appreciated
- Mark as New
- Bookmark
- Subscribe
- Mute
- Subscribe to RSS Feed
- Permalink
- Report Inappropriate Content
Try this expression as Sorting Numberic Ascending? Try anyone of these
1) WKNbr
2) SubField('Week ' & WKNbr, ' ', -1)
- Mark as New
- Bookmark
- Subscribe
- Mute
- Subscribe to RSS Feed
- Permalink
- Report Inappropriate Content
Not working
- Mark as New
- Bookmark
- Subscribe
- Mute
- Subscribe to RSS Feed
- Permalink
- Report Inappropriate Content
Can you attach your app to test
- Mark as New
- Bookmark
- Subscribe
- Mute
- Subscribe to RSS Feed
- Permalink
- Report Inappropriate Content
unfortunately i cant, due to data loaded in App.
following is the part of data model, which will get values for matching WkNbr
- Mark as New
- Bookmark
- Subscribe
- Mute
- Subscribe to RSS Feed
- Permalink
- Report Inappropriate Content
Don't worry that and remove that and share scramble dataa with only one chart which you need..