Unlock a world of possibilities! Login now and discover the exclusive benefits awaiting you.
- Qlik Community
- :
- All Forums
- :
- QlikView App Dev
- :
- Re: Split the total bar in the stacked chart
- Subscribe to RSS Feed
- Mark Topic as New
- Mark Topic as Read
- Float this Topic for Current User
- Bookmark
- Subscribe
- Mute
- Printer Friendly Page
- Mark as New
- Bookmark
- Subscribe
- Mute
- Subscribe to RSS Feed
- Permalink
- Report Inappropriate Content
Split the total bar in the stacked chart
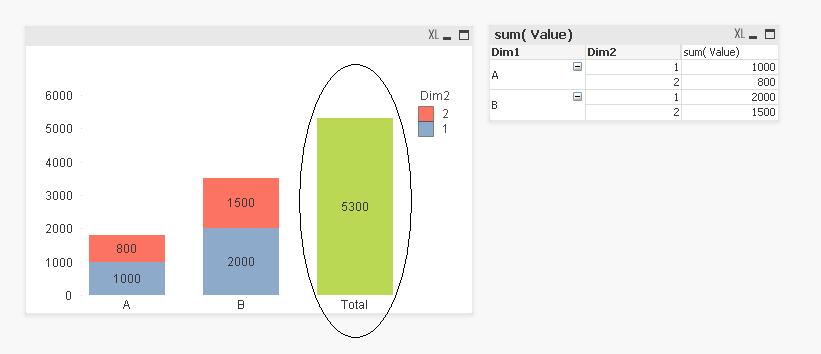
I have a stacked chart with two dimensions. I am able to show the stacked chart but having trouble to split the 'Total" bar. Please see the sample attached qlikview file and the screen shot:
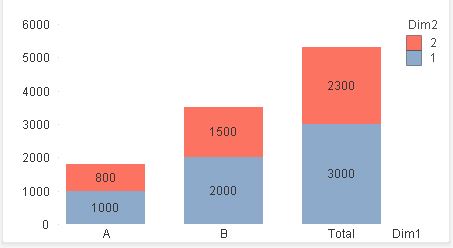
I want the "Total" bar to split into 3000 (Which is the total for Dim2=1) and 2300 (Which is the total for Dim2=2).
Thank you for your time.
Accepted Solutions
- Mark as New
- Bookmark
- Subscribe
- Mute
- Subscribe to RSS Feed
- Permalink
- Report Inappropriate Content
May be this?
- Mark as New
- Bookmark
- Subscribe
- Mute
- Subscribe to RSS Feed
- Permalink
- Report Inappropriate Content
May be this?
- Mark as New
- Bookmark
- Subscribe
- Mute
- Subscribe to RSS Feed
- Permalink
- Report Inappropriate Content
Anil,
Is it possible to do on the front end with out the island table ?
- Mark as New
- Bookmark
- Subscribe
- Mute
- Subscribe to RSS Feed
- Permalink
- Report Inappropriate Content
I really hate to do in UI, It kills the performance. I believe we can club using this.
Pick(Match($Field, Dim1), 'Dim1' , 'TOTAL')
Note - Without hesitate i will say, This will show "out of object" if filter happens and search to all fields and pick only Dim1 to clun TOTAL. That may not a good practice.
Q) Why you didn't like Island Table?
- Mark as New
- Bookmark
- Subscribe
- Mute
- Subscribe to RSS Feed
- Permalink
- Report Inappropriate Content
Agree, Island table is the best but I should not touch the script.
- Mark as New
- Bookmark
- Subscribe
- Mute
- Subscribe to RSS Feed
- Permalink
- Report Inappropriate Content
Good, Still we can force it.. I got same from customer but i request them to go with Island one only. Let me invite tresesco whether he has some inputs to understand better..
- Mark as New
- Bookmark
- Subscribe
- Mute
- Subscribe to RSS Feed
- Permalink
- Report Inappropriate Content
Alternatively you can use synthetic dimension (using valuelist()/valueloop()). However, that would not be responsive to your selection. Hence the better is what Anil has already suggested.
Thanks Anil for the invite.
- Mark as New
- Bookmark
- Subscribe
- Mute
- Subscribe to RSS Feed
- Permalink
- Report Inappropriate Content
If you have time, Please made in QVW using ValueList and ValueLoop. I even wonder how this goes..