Unlock a world of possibilities! Login now and discover the exclusive benefits awaiting you.
- Qlik Community
- :
- All Forums
- :
- QlikView App Dev
- :
- Stack barchart
- Subscribe to RSS Feed
- Mark Topic as New
- Mark Topic as Read
- Float this Topic for Current User
- Bookmark
- Subscribe
- Mute
- Printer Friendly Page
- Mark as New
- Bookmark
- Subscribe
- Mute
- Subscribe to RSS Feed
- Permalink
- Report Inappropriate Content
Stack barchart
Hi Qlik Experts,
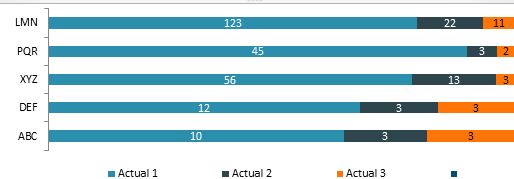
I have to create a stack bar chart , where all 4 stacks should cover 100% display but do not show value as % in data points.
They should show actual numbers for particular selection as shown in example below.
For eg- if for Jan, LMN has "Actual 1"=123 , "Actual 2"=22,"Actual 3"=11, then it should show as image 2.

I tried creating it by using normal stackbar chart & showing datapoint as number or % but its not solving the purpose.
Because when I try showing actuals as data points , the stack doesn't cover 100% display.

Image created in excel.
Appreciate the help,
Thanks in adv.
- Tags:
- qlikview calculation
- « Previous Replies
-
- 1
- 2
- Next Replies »
Accepted Solutions
- Mark as New
- Bookmark
- Subscribe
- Mute
- Subscribe to RSS Feed
- Permalink
- Report Inappropriate Content
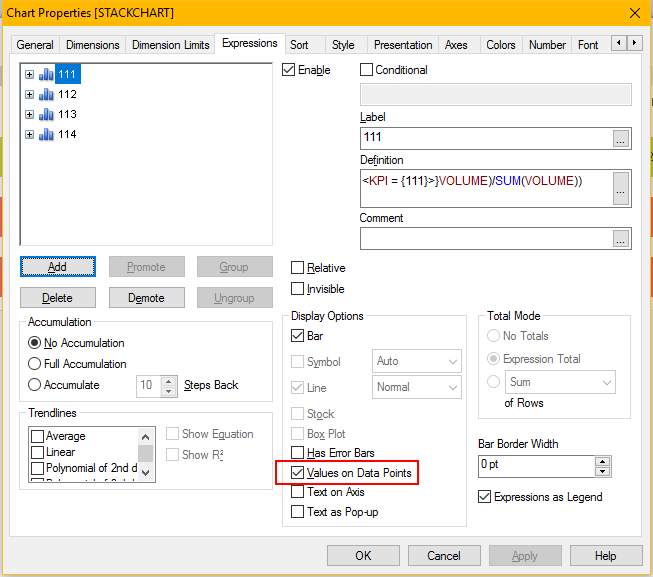
you can do it in two ways
1.one dimension and four expressions
2.two dimensions and one expressions
PFA
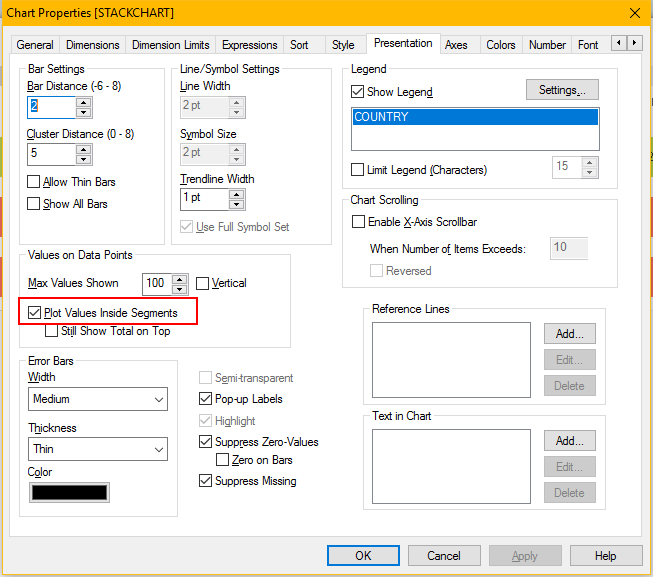
plz make sure that these two checkboxes are checked

 @
@
- Mark as New
- Bookmark
- Subscribe
- Mute
- Subscribe to RSS Feed
- Permalink
- Report Inappropriate Content
Try to build same in Qlikview and explain where it is not working. I may understand your intend but more clear may help us
- Mark as New
- Bookmark
- Subscribe
- Mute
- Subscribe to RSS Feed
- Permalink
- Report Inappropriate Content
like this
- Mark as New
- Bookmark
- Subscribe
- Mute
- Subscribe to RSS Feed
- Permalink
- Report Inappropriate Content
In qlikview 100% stackbar graph is correct but it gives me below data points-

But actually I want 100% range stackbar chart to show data points as original actual value as in we get in normal stack chart as below-

- Mark as New
- Bookmark
- Subscribe
- Mute
- Subscribe to RSS Feed
- Permalink
- Report Inappropriate Content
Dual() function will help you out

check this
- Mark as New
- Bookmark
- Subscribe
- Mute
- Subscribe to RSS Feed
- Permalink
- Report Inappropriate Content
Hi,
may be like this,
Find the attached Application (Updated File)
Thanks,
Mukram.
- Mark as New
- Bookmark
- Subscribe
- Mute
- Subscribe to RSS Feed
- Permalink
- Report Inappropriate Content
Thank You !
- Mark as New
- Bookmark
- Subscribe
- Mute
- Subscribe to RSS Feed
- Permalink
- Report Inappropriate Content
Hi Dave, the formula isn't working in my case , its giving me abrupt result on data points. (though creating 100% range stackchart)
Like A1,A2 mentioned in your doc are fields
in my case, field is date and stacks are generated using variables in expression.
I tried replacing A1,A2 with expressions , its giving me abrupt result on data points. (though creating 100% range stackchart)
- Mark as New
- Bookmark
- Subscribe
- Mute
- Subscribe to RSS Feed
- Permalink
- Report Inappropriate Content
Hi,
Have you checked my Solution?
- Mark as New
- Bookmark
- Subscribe
- Mute
- Subscribe to RSS Feed
- Permalink
- Report Inappropriate Content
can you provide a screenshot of your problem ? or provide a sample app ![]()
I'm not sure what does "abrupt result on data points" means , data label not looks good ? if yes ,you can use Num() function to format the data
- « Previous Replies
-
- 1
- 2
- Next Replies »