Unlock a world of possibilities! Login now and discover the exclusive benefits awaiting you.
- Qlik Community
- :
- All Forums
- :
- QlikView App Dev
- :
- Stacked Bar Chart Issue
- Subscribe to RSS Feed
- Mark Topic as New
- Mark Topic as Read
- Float this Topic for Current User
- Bookmark
- Subscribe
- Mute
- Printer Friendly Page
- Mark as New
- Bookmark
- Subscribe
- Mute
- Subscribe to RSS Feed
- Permalink
- Report Inappropriate Content
Stacked Bar Chart Issue
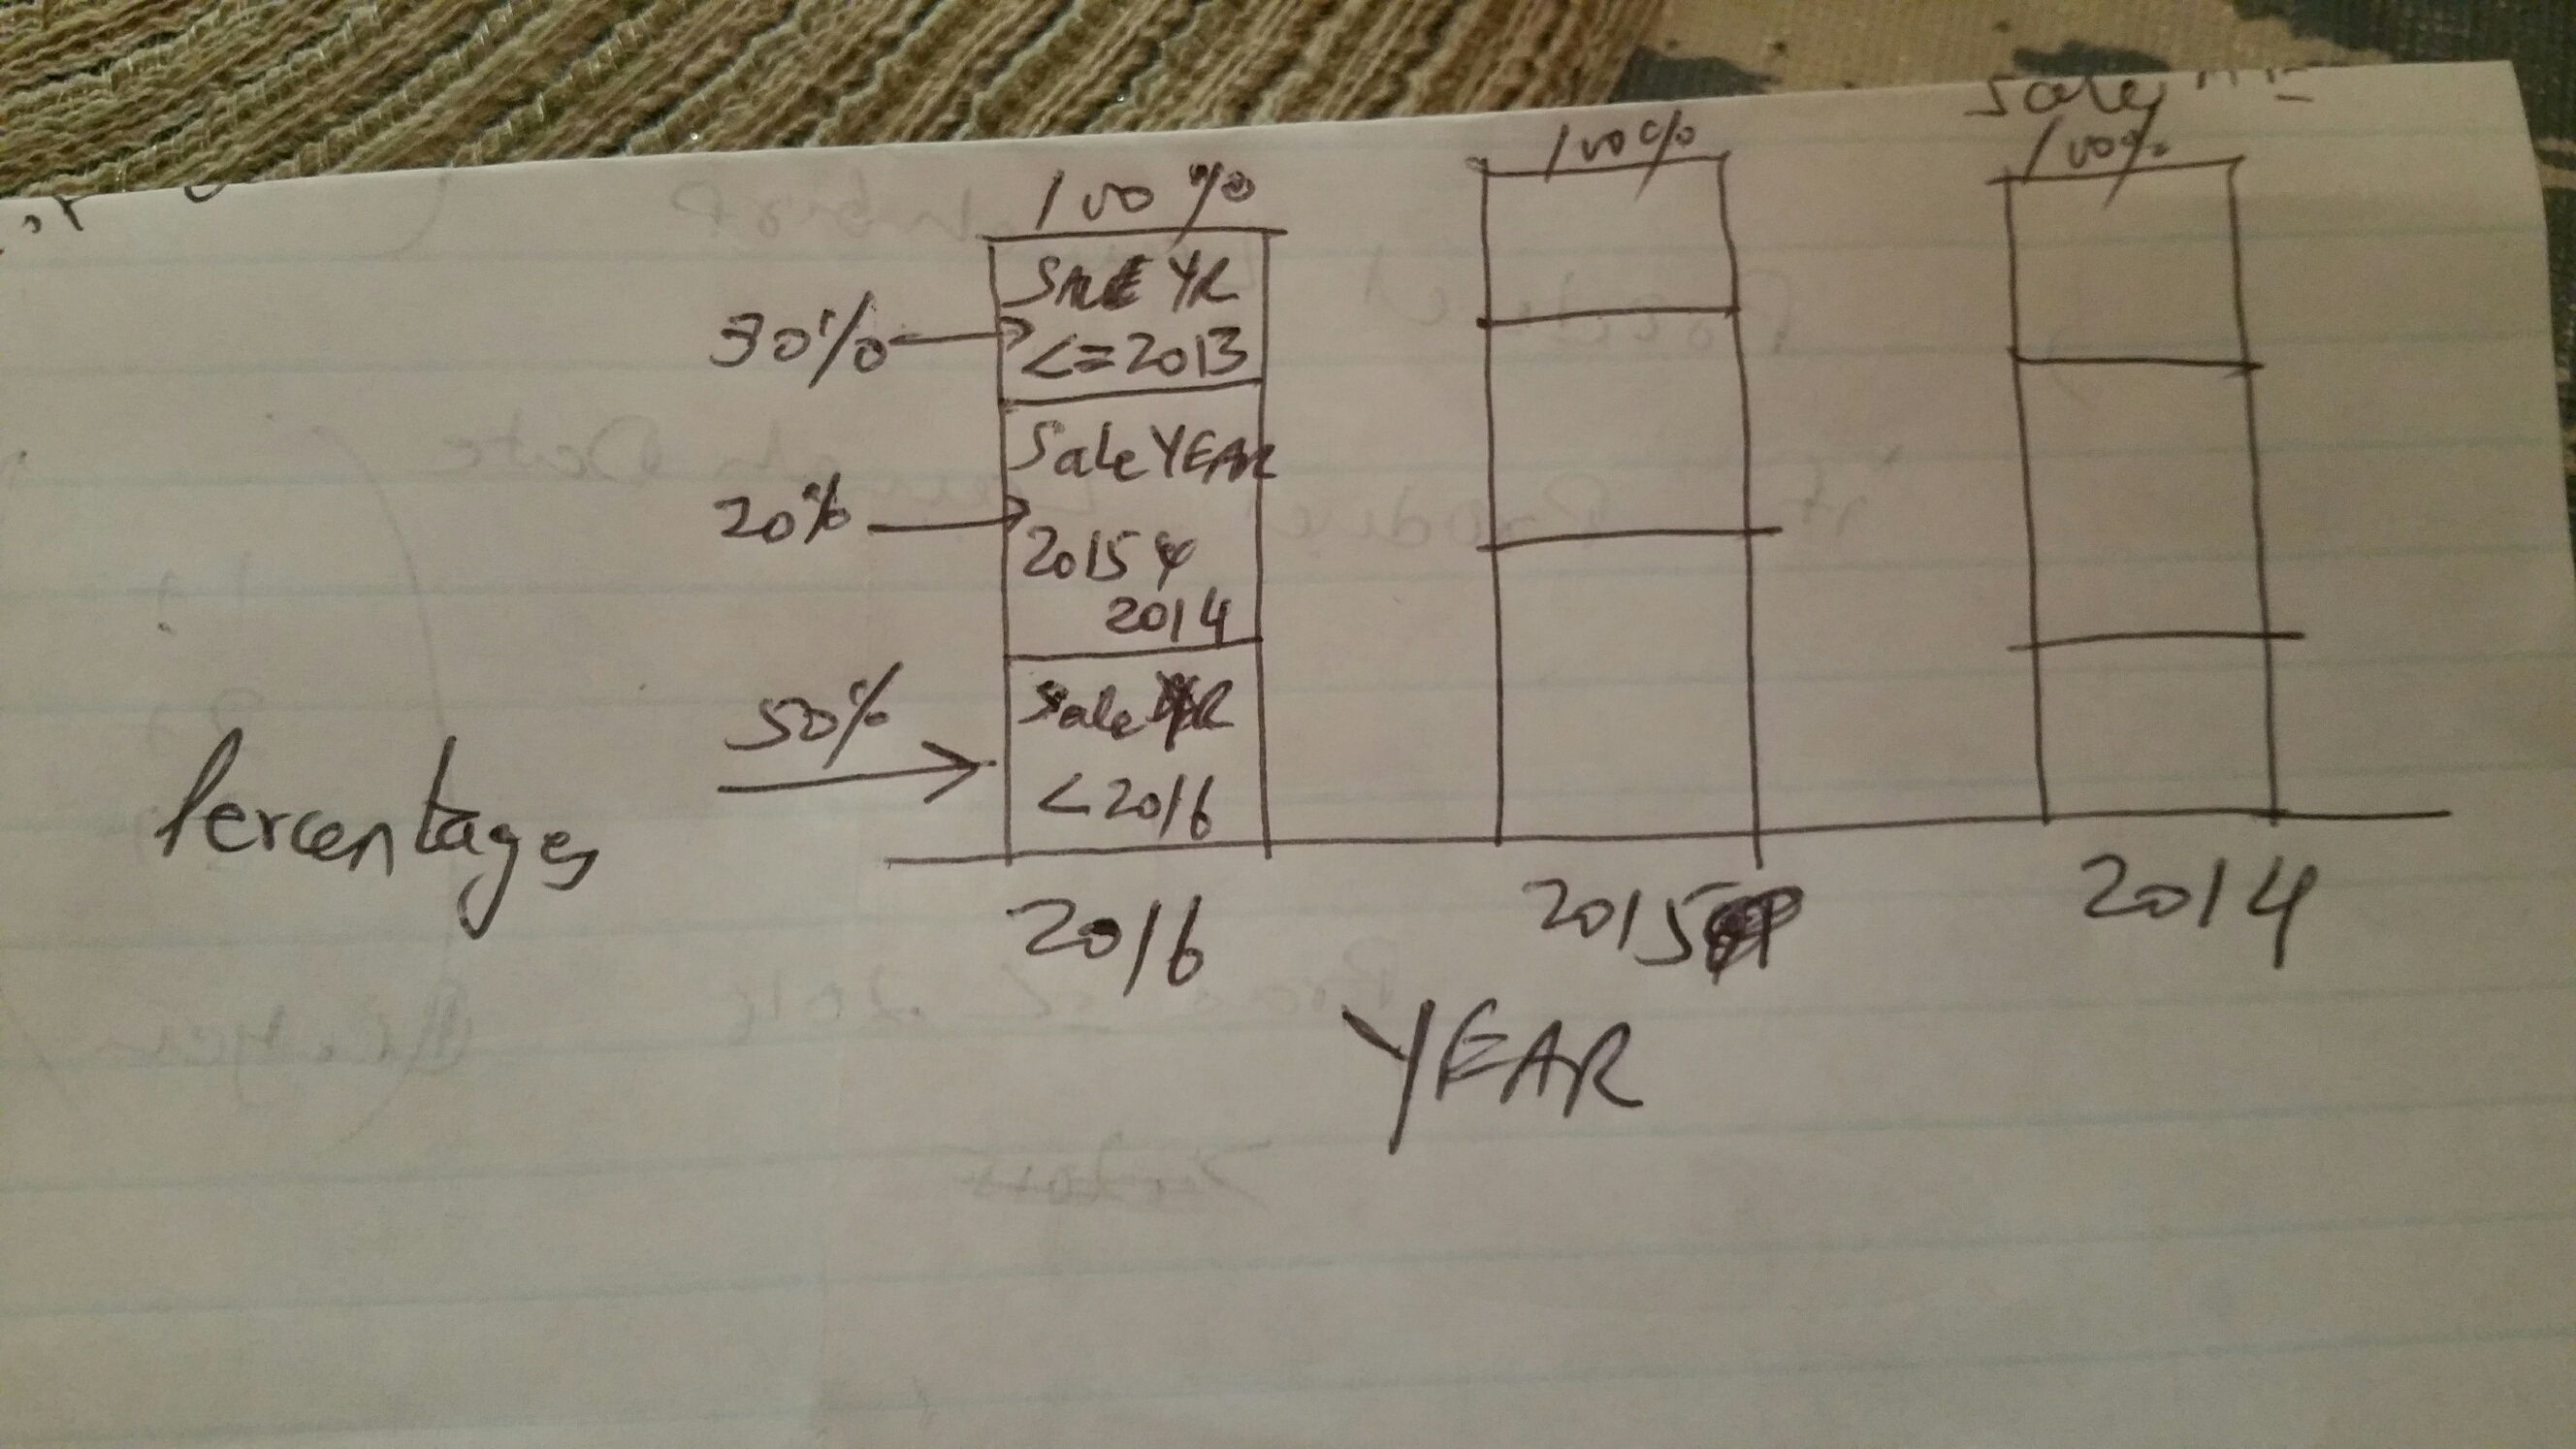
Attached is the sketch of the required bar chart. Along with the sample Excel file.
Looking for help in building this chart
- « Previous Replies
- Next Replies »
- Mark as New
- Bookmark
- Subscribe
- Mute
- Subscribe to RSS Feed
- Permalink
- Report Inappropriate Content
HOw I can attached the sample file and the qvw here ?
- Mark as New
- Bookmark
- Subscribe
- Mute
- Subscribe to RSS Feed
- Permalink
- Report Inappropriate Content
Click reply.
Click Use advanced editor (top right corner).
Click attach (near bottom).
- Mark as New
- Bookmark
- Subscribe
- Mute
- Subscribe to RSS Feed
- Permalink
- Report Inappropriate Content
You can also see the instructions here: Uploading a Sample
- Mark as New
- Bookmark
- Subscribe
- Mute
- Subscribe to RSS Feed
- Permalink
- Report Inappropriate Content
I thought I resolved it, but the sample I gave you has both Sale Year and Year in the same table, but in my original data set they are in different tables. So I created a variable. So in the sample data the dimensions were Year, Sale Year
which was
If(Year([Sale Date]) >= Year, '<1 Year',
If(Year([Sale Date]) >= ((Year)-2) and Year([Sale Date]) < Year,'Prior 2 Years',
If(Year([Sale Date]) <= ((Year)-3),'< 3 Years'))) as [Sales Year] in the script
In my original data set now, I put all the above in a variable and used that variable as a dimension for [Sale Year]
vSaleYear
If(Year([Sale Date]) >= Year, '<1 Year',
If(Year([Sale Date]) >= ((Year)-2) and Year([Sale Date]) < Year,'Prior 2 Years',
If(Year([Sale Date]) <= ((Year)-3),'< 3 Years'))) and used that in my Bar Chart but I get 100% now for each Year because the values Sum(Amount) and Sum(Total <Year> Amount) are the same.
The same logic works perfectly fine, if I put that logic in the script like we did earlier. See the attached sample and qvw file. WIth two charts, one with variable and other without the variable
Am I missing something here?
- « Previous Replies
- Next Replies »