Unlock a world of possibilities! Login now and discover the exclusive benefits awaiting you.
- Qlik Community
- :
- All Forums
- :
- QlikView App Dev
- :
- Re: Stacked Bar chart with 2 expressions and 2 dim...
- Subscribe to RSS Feed
- Mark Topic as New
- Mark Topic as Read
- Float this Topic for Current User
- Bookmark
- Subscribe
- Mute
- Printer Friendly Page
- Mark as New
- Bookmark
- Subscribe
- Mute
- Subscribe to RSS Feed
- Permalink
- Report Inappropriate Content
Stacked Bar chart with 2 expressions and 2 dimensions
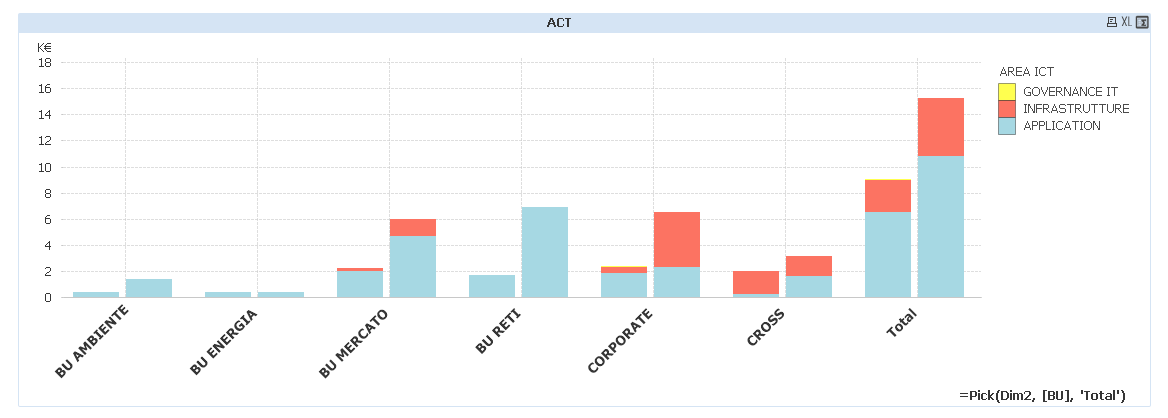
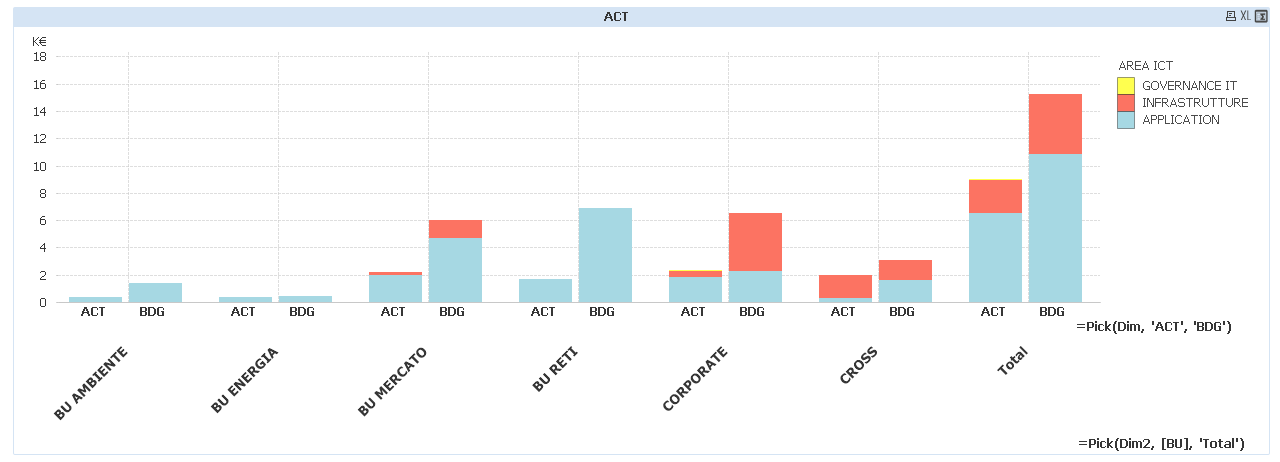
Hi, i want to create a stacked bar chart with 2 expressions (ACT vs BDG) and two dimensions, first one in x axes (BU) and the second one stacked (AREA ICT). I would these two charts in a single one with ACT and BDG side by side:

See qvw attached
- « Previous Replies
-
- 1
- 2
- Next Replies »
- Mark as New
- Bookmark
- Subscribe
- Mute
- Subscribe to RSS Feed
- Permalink
- Report Inappropriate Content
Here is the island dimension solution
- Mark as New
- Bookmark
- Subscribe
- Mute
- Subscribe to RSS Feed
- Permalink
- Report Inappropriate Content
Enabled the Act and Bud labels if that is something you need
- Mark as New
- Bookmark
- Subscribe
- Mute
- Subscribe to RSS Feed
- Permalink
- Report Inappropriate Content
Great! Thank you so much
- Mark as New
- Bookmark
- Subscribe
- Mute
- Subscribe to RSS Feed
- Permalink
- Report Inappropriate Content
hi sunny ,
the below example din't work out for me could please help me on the requirement.
Requirement:
i have two measures and 2 dimensions(Month and col) .Month is having all the months and colomn1 having yes ,no,# values(ignore #).Expressions are sum(current Year sales ) and sum(Previous Year sales).
i need to built a bar chart with sum(current Year sales ) and sum(Previous Year sales) and on top of this bar need to plat colomn1 field values.

I have implemented but i am getting single expression values .please help me on this
- Mark as New
- Bookmark
- Subscribe
- Mute
- Subscribe to RSS Feed
- Permalink
- Report Inappropriate Content
Hi Sunny,
Could you please share example in QVF. I'm trying to implement same in Qliksense app. I am not able to convert your app to QVF.
Thanks
Arusana
- « Previous Replies
-
- 1
- 2
- Next Replies »