Unlock a world of possibilities! Login now and discover the exclusive benefits awaiting you.
- Qlik Community
- :
- All Forums
- :
- QlikView App Dev
- :
- Re: Stacked bar chart help
- Subscribe to RSS Feed
- Mark Topic as New
- Mark Topic as Read
- Float this Topic for Current User
- Bookmark
- Subscribe
- Mute
- Printer Friendly Page
- Mark as New
- Bookmark
- Subscribe
- Mute
- Subscribe to RSS Feed
- Permalink
- Report Inappropriate Content
Stacked bar chart help
Hello,
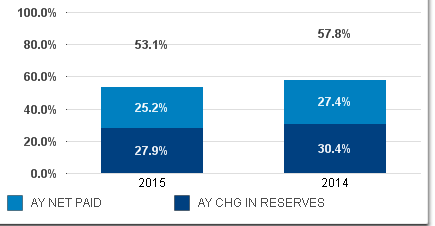
I have created a stacked bar chart that I am looking to have the components % in each bar, with the total directly and dynamically above the bar. So far I have been able to create is:

I have an invisible bar above the chart with the data inside the data point. Is there a setting to allow the 53.1% and 57.8% to be directly above the light blue section? Also, I tried the value on axis and that did not meet to the user's liking.
Thank you,
Justin
- Mark as New
- Bookmark
- Subscribe
- Mute
- Subscribe to RSS Feed
- Permalink
- Report Inappropriate Content
See attached example.
talk is cheap, supply exceeds demand
- Mark as New
- Bookmark
- Subscribe
- Mute
- Subscribe to RSS Feed
- Permalink
- Report Inappropriate Content
Hi Gysbert,
Thank you for the help, is there a way to reduce the space between the total at the top, and the bar chart? The user is looking to limit the white space between the total and the components of the bar chart.
Thank you,
Justin
- Mark as New
- Bookmark
- Subscribe
- Mute
- Subscribe to RSS Feed
- Permalink
- Report Inappropriate Content
You can try using the Bar Offset setting.
talk is cheap, supply exceeds demand
- Mark as New
- Bookmark
- Subscribe
- Mute
- Subscribe to RSS Feed
- Permalink
- Report Inappropriate Content
Gysbert,
I am having difficulty bringing down the top bar's data point. I can move it up with no problem, but if I either input a negative value or using the expressions, I cannot seem to move down the data point. Any thoughts?
Here are my expressions if it helps:
Bottom Dark Blue -
=((Sum ({< [CAT IND]={'N'}, [MONTH-NUMERIC] = {"<=$(=max({<YEAR={$(vBusinessYear)}>} [MONTH-NUMERIC]))"}, [DATA ORIGIN]={'SMG'}, [NEW RENEW IND]={'COMBINED'}>}[AY CHG IN CASE/STAT])+
Sum ({< [CAT IND]={'N'}, [MONTH-NUMERIC] = {"<=$(=max({<YEAR={$(vBusinessYear)}>} [MONTH-NUMERIC]))"}, [DATA ORIGIN]={'SMG'}, [NEW RENEW IND]={'COMBINED'}>}[AY CHG IN SUPP])+
Sum ({< [CAT IND]={'N'}, [MONTH-NUMERIC] = {"<=$(=max({<YEAR={$(vBusinessYear)}>} [MONTH-NUMERIC]))"}, [DATA ORIGIN]={'SMG'}, [NEW RENEW IND]={'COMBINED'}>}[AY CHG IN IBNR]))
/
Sum ({< [CAT IND]={'N'}, [MONTH-NUMERIC] = {"<=$(=max({<YEAR={$(vBusinessYear)}>} [MONTH-NUMERIC]))"}, [DATA ORIGIN]={'SMG'}, [NEW RENEW IND]={'COMBINED'}>}[DIRECT EARNED PREMIUM]))
Middle - Lighter blue -
=((Sum ({< [CAT IND]={'N'}, [MONTH-NUMERIC] = {"<=$(=max({<YEAR={$(vBusinessYear)}>} [MONTH-NUMERIC]))"}, [DATA ORIGIN]={'SMG'}, [NEW RENEW IND]={'COMBINED'}>}[AY PAID LOSS])+
Sum ({< [CAT IND]={'N'}, [MONTH-NUMERIC] = {"<=$(=max({<YEAR={$(vBusinessYear)}>} [MONTH-NUMERIC]))"}, [DATA ORIGIN]={'SMG'}, [NEW RENEW IND]={'COMBINED'}>}[AY ALLOC EXPENSES])+
Sum ({< [CAT IND]={'N'}, [MONTH-NUMERIC] = {"<=$(=max({<YEAR={$(vBusinessYear)}>} [MONTH-NUMERIC]))"}, [DATA ORIGIN]={'SMG'}, [NEW RENEW IND]={'COMBINED'}>}[AY SALVAGE/SUBRO]))
/
Sum ({< [CAT IND]={'N'}, [MONTH-NUMERIC] = {"<=$(=max({<YEAR={$(vBusinessYear)}>} [MONTH-NUMERIC]))"}, [DATA ORIGIN]={'SMG'}, [NEW RENEW IND]={'COMBINED'}>}[DIRECT EARNED PREMIUM]))
Top invisible stacked bar which is the total of both:
=(Sum ({< [CAT IND]={'N'}, [MONTH-NUMERIC] = {"<=$(=max({<YEAR={$(vBusinessYear)}>} [MONTH-NUMERIC]))"}, [DATA ORIGIN]={'SMG'}, [NEW RENEW IND]={'COMBINED'}>}[AY INCURRED W ALAE])/
Sum ({< [CAT IND]={'N'}, [MONTH-NUMERIC] = {"<=$(=max({<YEAR={$(vBusinessYear)}>} [MONTH-NUMERIC]))"}, [DATA ORIGIN]={'SMG'}, [NEW RENEW IND]={'COMBINED'}>}[DIRECT EARNED PREMIUM]))
Thank you for all the help so far,
Justin
- Mark as New
- Bookmark
- Subscribe
- Mute
- Subscribe to RSS Feed
- Permalink
- Report Inappropriate Content
Please post a qlikview document that demonstrates the problem.
talk is cheap, supply exceeds demand