Unlock a world of possibilities! Login now and discover the exclusive benefits awaiting you.
- Qlik Community
- :
- All Forums
- :
- QlikView App Dev
- :
- Re: Stacked bar chart in a table - Ideas?
- Subscribe to RSS Feed
- Mark Topic as New
- Mark Topic as Read
- Float this Topic for Current User
- Bookmark
- Subscribe
- Mute
- Printer Friendly Page
- Mark as New
- Bookmark
- Subscribe
- Mute
- Subscribe to RSS Feed
- Permalink
- Report Inappropriate Content
Stacked bar chart in a table - Ideas?
Hi everyone,
Any idea about displaying a stacked column bar chart in a table in Qlikview 11?
I have student test scores and each score is associated with a proficiency level. (Fail,Pass,Advanced)
I need to display a percentage of F/P/A out of the total count of proficiency Levels as stacked bars. Why in a table? Because each row will display this information for multiple schools.
I calculated the percentages but I can't figure out how to display them in the same line as stacked columns.
Thanks a lot in advance for your ideas 
- Mark as New
- Bookmark
- Subscribe
- Mute
- Subscribe to RSS Feed
- Permalink
- Report Inappropriate Content
Hi Cristian,
Can you please leave a qvd or a excel sample so we can make a solution for you?
Regards,
MB
- Mark as New
- Bookmark
- Subscribe
- Mute
- Subscribe to RSS Feed
- Permalink
- Report Inappropriate Content
Like this?
Write 3 expression & use Stack style from properties:
Fail : Count({<Status={'Fail'>}disctinct StudentID)/Count(Total Disticnt StudentID)
//Here you can use it into % or integer format..
Replace Fail with Pass & advanced for others
- Mark as New
- Bookmark
- Subscribe
- Mute
- Subscribe to RSS Feed
- Permalink
- Report Inappropriate Content
this is how i wrote my expressions:
=(Count(distinct {<[ProficiencyLevel] = {'Advanced'}>} TestScore) / Count(distinct TestScore) )*100
I wrote this in variables so i can use them as per attached screenshot.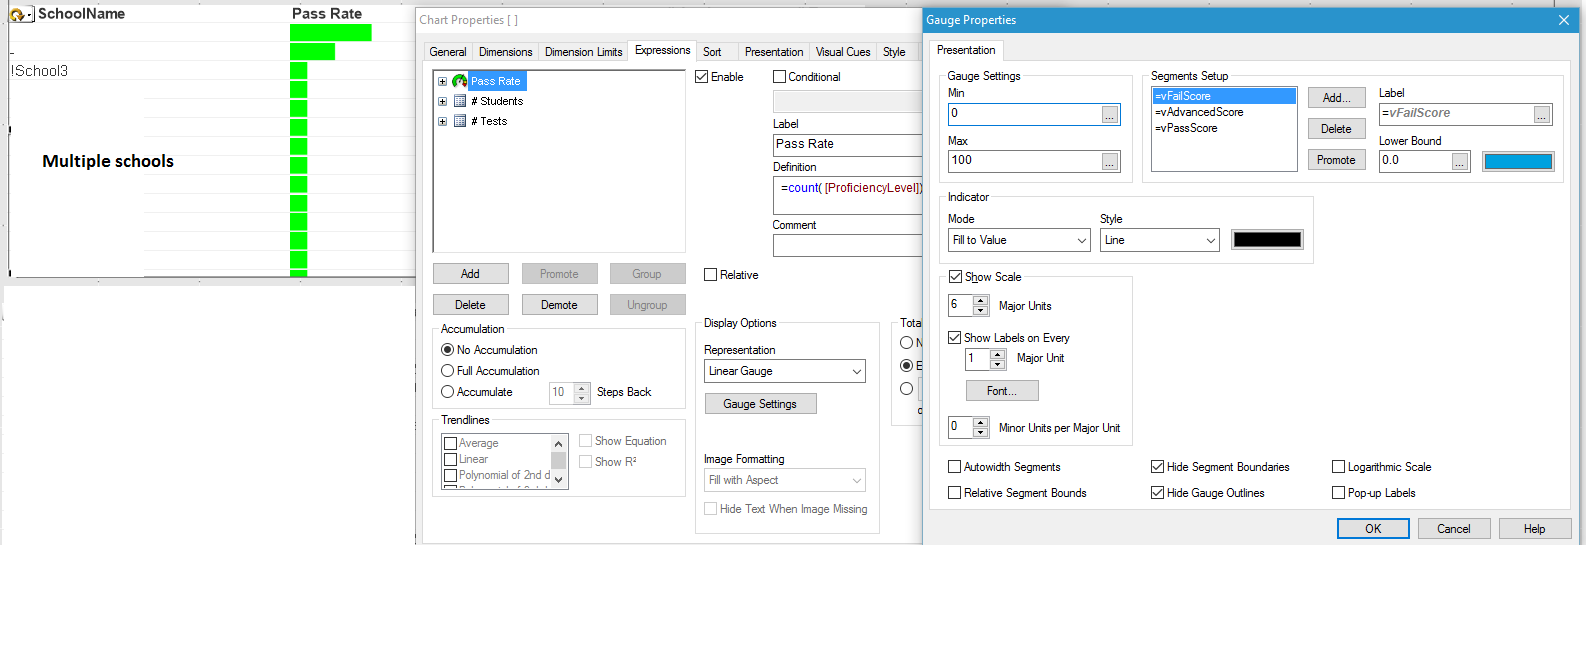
- Mark as New
- Bookmark
- Subscribe
- Mute
- Subscribe to RSS Feed
- Permalink
- Report Inappropriate Content
Hi Miguel,
here's what I was able to do so far. Sorry for the data past. Cant't find how to attach an excel file.
| School Name | Grade | student Name | Test Score | Proficiency Level |
| School 1 | 1 | Student 1 | 8 | Fail |
| School 1 | 1 | Student 2 | 9 | Fail |
| School 1 | 2 | Student 3 | 9 | Pass |
| School 1 | 2 | Student 4 | 10 | Pass |
| School 1 | 3 | Student 5 | 10 | Advanced |
| School 2 | 1 | Student 6 | 8 | Fail |
| School 2 | 1 | Student 7 | 9 | Fail |
| School 2 | 1 | Student 8 | 9 | Pass |
| School 2 | 2 | Student 9 | 10 | Pass |
| School 2 | 2 | Student 10 | 10 | Advanced |

- Mark as New
- Bookmark
- Subscribe
- Mute
- Subscribe to RSS Feed
- Permalink
- Report Inappropriate Content
Hi Miguel,
Any luck with the charts I was talking about?
Thanks in advance.