Unlock a world of possibilities! Login now and discover the exclusive benefits awaiting you.
- Qlik Community
- :
- All Forums
- :
- QlikView App Dev
- :
- Re: Stacked bar graph is killing me
- Subscribe to RSS Feed
- Mark Topic as New
- Mark Topic as Read
- Float this Topic for Current User
- Bookmark
- Subscribe
- Mute
- Printer Friendly Page
- Mark as New
- Bookmark
- Subscribe
- Mute
- Subscribe to RSS Feed
- Permalink
- Report Inappropriate Content
Stacked bar graph is killing me
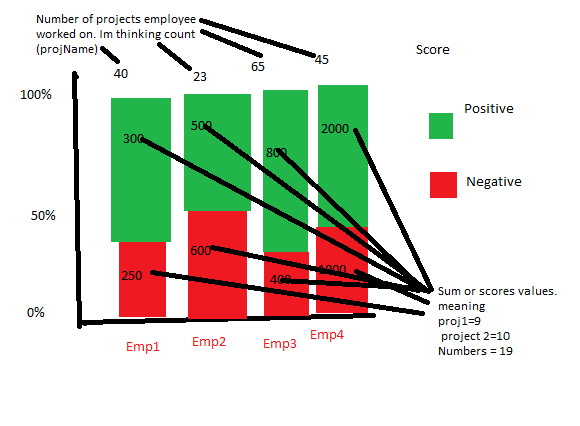
Im trying to make a stacked bar graph. The left y dimenstions should be a percentage breakdown by tens, 0,10,20,30...100. each bar represent another employee name. the bars upward (no under x-axis extending bars) bars are divided into two parts, the bottom should be the red percentage of negative scored performance and the top should be the positive green percentage of positivly scored performance ratings.
Meaning
total bar height=100% for each one
Red part of bar= sum(fabs(negative score))/total score
Green part of bar= sum(positive score)/total score
sample data:
Employee 1 ,project 1, -45
Employee 1 , project 2, 84
Employee 1 , project 2, 8
Employee 1 , project 2, 24 <-project can have multiple rating
Employee 2 ,project 3, -95
Employee 2 , project 4, -99 <-employee2 will be an all red bard with a height of
Employee 2 ,project 5, -45
Employee 3 , project 2, 84
Employee 3 , project 7, 4
Employee 3 , project 7, -89
Employee 3 , project 7, 50
Please help, ive spend a week on this and i got no where
Assume Im a begginer and need as detailed help as possible. Please
see the attached pic. Picture is not based on numbers above
Accepted Solutions
- Mark as New
- Bookmark
- Subscribe
- Mute
- Subscribe to RSS Feed
- Permalink
- Report Inappropriate Content
Aha, thanks for the data.
I modified the solution a little to show each bar as 100%.
- Mark as New
- Bookmark
- Subscribe
- Mute
- Subscribe to RSS Feed
- Permalink
- Report Inappropriate Content
Can you load some data into a QVW and post it?
- Mark as New
- Bookmark
- Subscribe
- Mute
- Subscribe to RSS Feed
- Permalink
- Report Inappropriate Content
Would copying and pasting a bunch of columns suffice. Im not sure how to add only a few columns of qvw that access a database. Sorry Im really a begginer and im trying to pick all this
(KEY)Project Name | Score | Employee
Project 1 45 emp1
Project 1 5 emp1
Project 1 26 emp1
Project 1 6 emp2
Project 2 null/0 emp1
Project 2 null/0 emp3
Project 3 45 emp1
Project 3 -60 Null
Project 4 45 emp1
Project 5 -99 emp5
Project 5 -60 emp5
Project 5 25 emp10
Project 6 null/0 emp10
Project 5 45 emp1
Project 6 56 emp12
Project 7 -60 emp90
Its basically any permutation of the fields. Im sorry I couldnt give you the QVW file, if you rahter have that, can you explain to me how to do it if the source is from a local database and I cant give out the password/username
- Mark as New
- Bookmark
- Subscribe
- Mute
- Subscribe to RSS Feed
- Permalink
- Report Inappropriate Content
Hi,
I have attached a Qlikview file.
Where I have added a field in the load script if(Score>0,1,0) as Flag
And expression : Sum(Score*(If(Flag,1,-1))) on a Stacked bar chart.
Hope it helps...
- Mark as New
- Bookmark
- Subscribe
- Mute
- Subscribe to RSS Feed
- Permalink
- Report Inappropriate Content
Go into the script, and select Insert > Load Statement > Load Inline
Then you can just key the data in to make a load script.
- Mark as New
- Bookmark
- Subscribe
- Mute
- Subscribe to RSS Feed
- Permalink
- Report Inappropriate Content
Aha, thanks for the data.
I modified the solution a little to show each bar as 100%.
- Mark as New
- Bookmark
- Subscribe
- Mute
- Subscribe to RSS Feed
- Permalink
- Report Inappropriate Content
THNAK YOU