Unlock a world of possibilities! Login now and discover the exclusive benefits awaiting you.
- Qlik Community
- :
- All Forums
- :
- QlikView App Dev
- :
- Re: Starght table colrs (dynamic colrs)
- Subscribe to RSS Feed
- Mark Topic as New
- Mark Topic as Read
- Float this Topic for Current User
- Bookmark
- Subscribe
- Mute
- Printer Friendly Page
- Mark as New
- Bookmark
- Subscribe
- Mute
- Subscribe to RSS Feed
- Permalink
- Report Inappropriate Content
Starght table colrs (dynamic colrs)
Hi
I havedata like this , thiis is sample data i created, every time the data reload the data wil change i want to show the colrs in barchart will be sown in staright table as well, i dont want to be hardcode, everytime the data reload the Groups tickets aging will also change,
The below one is sample, actually there are large nof groups and everytime the data change the bars wil also change so we cannot hardode them..
Can anyone please help,..
Table:
Load * inline [
Ticket ,Group,date
123,A,5/06/2017
234,B,5/03/2017
345,C,5/05/2017
567,D,5/01/2017
789,E,5/02/2017
782,F,5/04/2017
];
Main:
LOAD *,
If (Diff <=1, '0-1 Day',
If(Diff >=2 AND Diff <=4, '2-4 Days',
If(Diff >=5 AND Diff <=7, '5-7 Days',
If(Diff >7, '> 7 Days')))) AS Bucket;
load *,
Date(now()) - date AS Diff
//Date(now()) - date#(date,'MM/DD/YY') AS Diff
Resident Table;
drop table Table;
- Mark as New
- Bookmark
- Subscribe
- Mute
- Subscribe to RSS Feed
- Permalink
- Report Inappropriate Content
May be see if this approach of setting the colors in script might help
Color Logic – loading multiple Color schemes
Load colours within QlikView script - QlikView Blog, QlikView Videos and Tips at QlikShare
- Mark as New
- Bookmark
- Subscribe
- Mute
- Subscribe to RSS Feed
- Permalink
- Report Inappropriate Content
Use persistent colors option under Colors tab
- Mark as New
- Bookmark
- Subscribe
- Mute
- Subscribe to RSS Feed
- Permalink
- Report Inappropriate Content
May be this for BG-Color
Color(FieldIndex('Group',Group))
- Mark as New
- Bookmark
- Subscribe
- Mute
- Subscribe to RSS Feed
- Permalink
- Report Inappropriate Content
where i have to keep this function
in the straight table
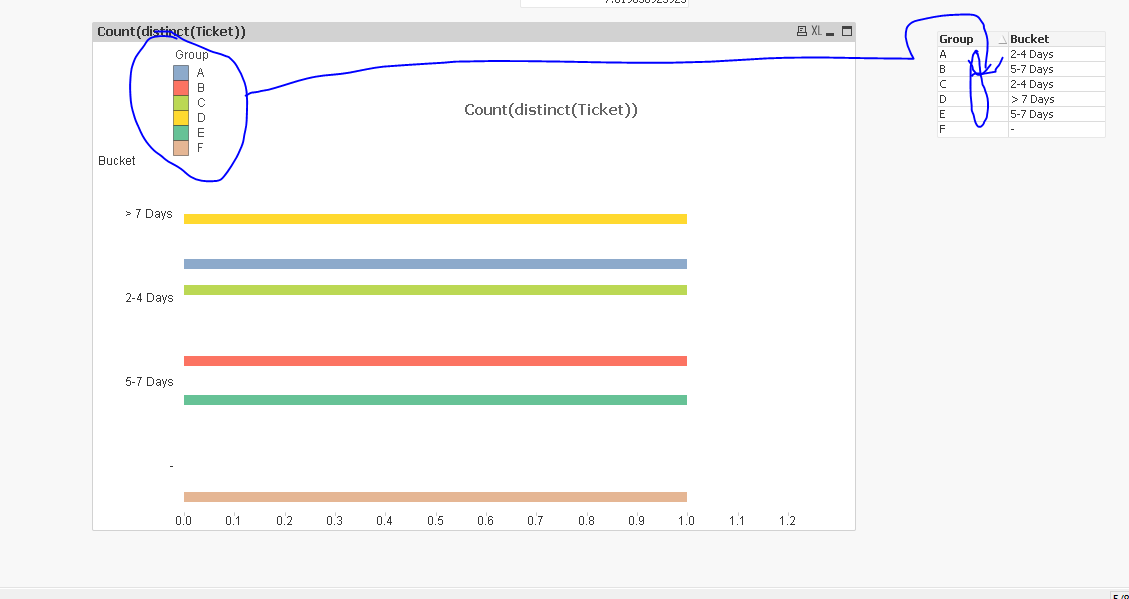
I have taken dimensions as Group and Bucket and expresion as count( distinct (ticket))
in which i have hided the expresion , where can i keep the above function in my dashboard and also i have used persistent colors and used first , but i am not geeting the correct colrs after getting the output
- Mark as New
- Bookmark
- Subscribe
- Mute
- Subscribe to RSS Feed
- Permalink
- Report Inappropriate Content
HI sailaja,
Go to expression tab-->click on the + symbol before your expression it will show some options list like Back groud color ans text color,You just click on background color and paste Color(FieldIndex('Group',Group)) expression
Regards,
Swathi