Unlock a world of possibilities! Login now and discover the exclusive benefits awaiting you.
- Qlik Community
- :
- All Forums
- :
- QlikView
- :
- Static Min / Max / Step question
- Subscribe to RSS Feed
- Mark Topic as New
- Mark Topic as Read
- Float this Topic for Current User
- Bookmark
- Subscribe
- Mute
- Printer Friendly Page
- Mark as New
- Bookmark
- Subscribe
- Mute
- Subscribe to RSS Feed
- Permalink
- Report Inappropriate Content
Static Min / Max / Step question
Qlikview Folks,
this is about finding the right values for Static Min / Static Max / Static Step that always, while grouping to day or month, on the x-axis legend only on entry per day / month appears.
While loading the data I apply a MasterCalender, calculating the following:
| Date(TempDate, 'DD.MM.YYYY') As MasterDate, | |
| date(monthstart(TempDate),'YYYY MMM') AS MasterYearMonth, |
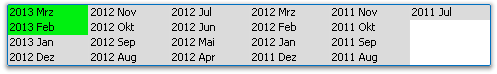
The user has on the Dashboard a listbox, where he can select MasterYearMonth:
NOW:
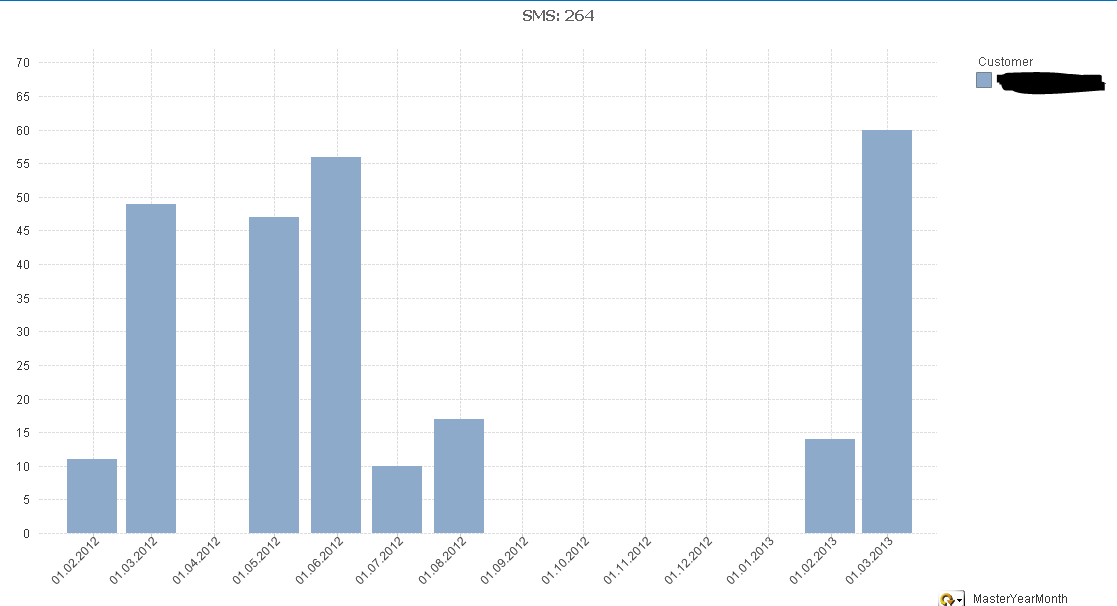
A bar chart, set on "Axes" tab to 'continous' looks like the below screenshot, if the complete date range is selected, and the user groups to 'MasterDate' (meaning Days).

If the user now groups to MasterYearMonth (meaning group to month), and having the complete date range selected -> it's still OK. It looks like this:
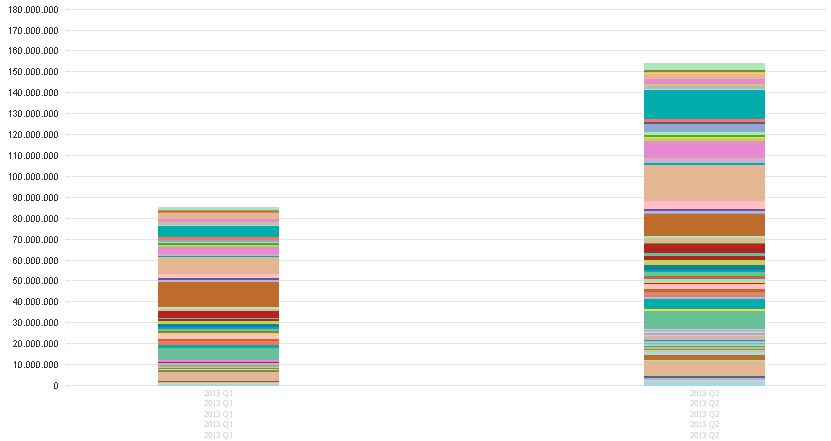
But if the user now selects (with grouping to MasterYearMonth) a just a few month, let's take the example Feb 2013 / Mar 2013, the graph looks like this:
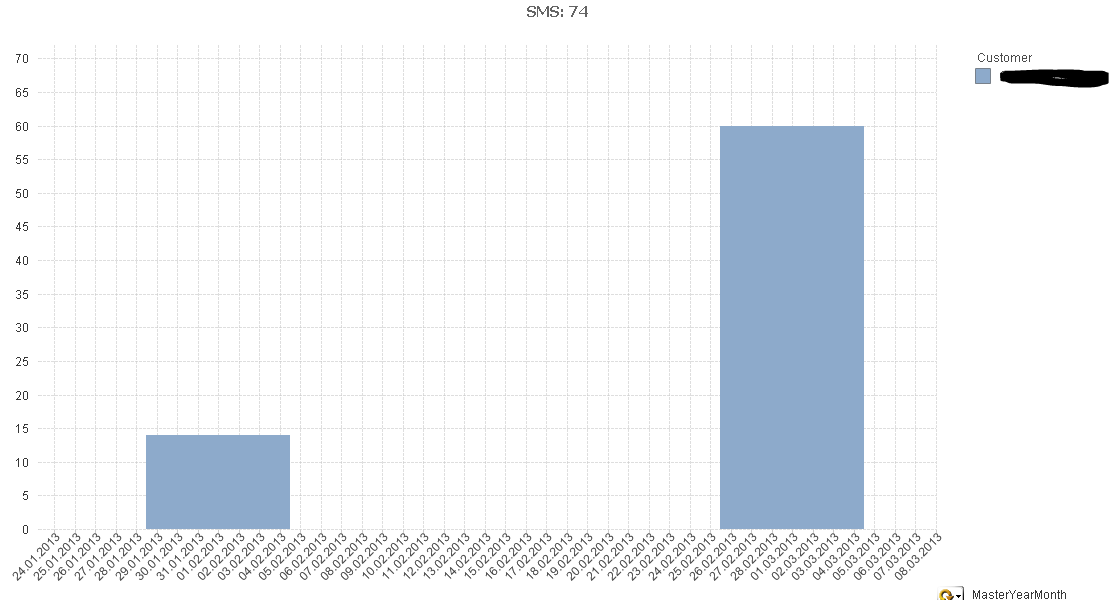
WHAT IS WRONG FOR ME:
The graph on the last picture shows much to much date information. I would like to just see: 01.02.2013 underneath the Feb bar, and 01.03.2013 underneath the March bar. And do not show so many dates.
I know, it's coming from the continous bar, the situation changes into another scattered picture, if the user selected maybe some other month. Always when there is "to much space" in the diagram, the x-axis is filled up with dates I don't want to see.
MY QUESTION IS NOW:
What do I need to enter in the Static Min, Static Max and Static Step fields to just show what I described. I tried hundred options, but can't find the right one. Right now I have inserted: Static Min: num(min(MasterDate)) / Static Max: num(max(MasterDate).
What do I now have to enter as a Static step to support my need?
Thank you for any hint...
Regards Mathias
P.S. -> My table contains the following data:
| MasterDate | Customer | Sales |
| 28.02.2012 | Demo | 8 |
| 29.02.2012 | Demo | 3 |
| 01.03.2012 | Demo | 10 |
| 02.03.2012 | Demo | 24 |
| 05.03.2012 | Demo | 10 |
| 06.03.2012 | Demo | 1 |
| 07.03.2012 | Demo | 1 |
| 08.03.2012 | Demo | 2 |
| 09.03.2012 | Demo | 1 |
| 08.05.2012 | Demo | 8 |
| 09.05.2012 | Demo | 3 |
| 10.05.2012 | Demo | 2 |
| 14.05.2012 | Demo | 3 |
| 15.05.2012 | Demo | 6 |
| 18.05.2012 | Demo | 1 |
| 22.05.2012 | Demo | 5 |
| 23.05.2012 | Demo | 5 |
| 25.05.2012 | Demo | 5 |
| 29.05.2012 | Demo | 5 |
| 30.05.2012 | Demo | 1 |
| 31.05.2012 | Demo | 3 |
| 01.06.2012 | Demo | 5 |
| 05.06.2012 | Demo | 1 |
| 06.06.2012 | Demo | 30 |
| 13.06.2012 | Demo | 2 |
| 15.06.2012 | Demo | 7 |
| 18.06.2012 | Demo | 1 |
| 22.06.2012 | Demo | 10 |
| 26.07.2012 | Demo | 2 |
| 30.07.2012 | Demo | 6 |
| 31.07.2012 | Demo | 2 |
| 01.08.2012 | Demo | 2 |
| 03.08.2012 | Demo | 1 |
| 06.08.2012 | Demo | 2 |
| 07.08.2012 | Demo | 1 |
| 08.08.2012 | Demo | 2 |
| 09.08.2012 | Demo | 6 |
| 10.08.2012 | Demo | 3 |
| 12.02.2013 | Demo | 6 |
| 25.02.2013 | Demo | 8 |
| 01.03.2013 | Demo | 32 |
| 04.03.2013 | Demo | 24 |
| 12.03.2013 | Demo | 4 |
- Mark as New
- Bookmark
- Subscribe
- Mute
- Subscribe to RSS Feed
- Permalink
- Report Inappropriate Content
See attached example.
talk is cheap, supply exceeds demand
- Mark as New
- Bookmark
- Subscribe
- Mute
- Subscribe to RSS Feed
- Permalink
- Report Inappropriate Content
Hi Gysbert,
thanks for taking care. Unfortunatelly I am using the Personal Edition of QlikView as we are currently evaluating which BI solution we will use.
Any chance to explain it to me here in the forum?
Thanks so much,
Regards,
Mathias
- Mark as New
- Bookmark
- Subscribe
- Mute
- Subscribe to RSS Feed
- Permalink
- Report Inappropriate Content
Hi Gysbert,
would appreciate if you can describe your solution here in the forum,
Thanks,
Regars Mathias
- Mark as New
- Bookmark
- Subscribe
- Mute
- Subscribe to RSS Feed
- Permalink
- Report Inappropriate Content
I'll give it a shot. First load the data including a MasteryearMonth field and create dates for missing months. This is to be able to display every month on the axis even if there are no sales for that month.
Data:
LOAD *, MonthStart(MasterDate) as MasteryearMonth;
LOAD date#(MasterDate,'DD.MM.YYYY') as MasterDate, Customer, Sales INLINE [
MasterDate, Customer, Sales
28.02.2012, Demo, 8
29.02.2012, Demo, 3
01.03.2012, Demo, 10
02.03.2012, Demo, 24
05.03.2012, Demo, 10
...etc
];
Temp:
load num(min(MasteryearMonth)) as MinM,
num(addmonths(max(MasteryearMonth),2)) as MaxM
resident Data;
Let vMin = peek('MinM');
Let vMax = peek('MaxM');
drop table Temp;
join
load addmonths($(vMin),iterno()-1) as MasteryearMonth
AutoGenerate 1
while num(addmonths($(vMin),iterno()-1)) < $(vMax);
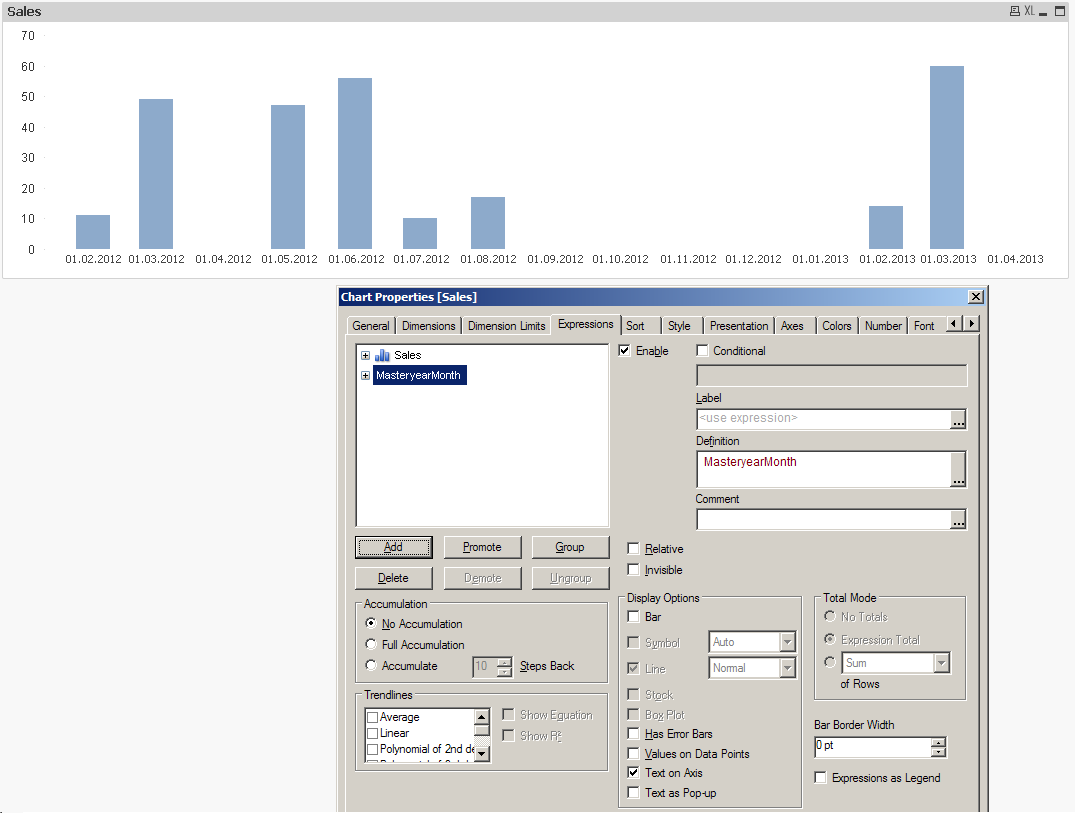
Then create a bar chart with MasteryearMonth as dimension and two expressions. Sum(Sales) to display the sales value per month and MasteryearMonth as second expression. The display options for the second expression have Bar disabled and Text on Axis enabled. This way the MasteryearMonth values will be shown on the axis. Next the dimension axis is disabled on the Axis tab. The Axis Color of the dimension axis is changed so the MasteryearMonth values on the axis are better visible. I think that's about it.
talk is cheap, supply exceeds demand
- Mark as New
- Bookmark
- Subscribe
- Mute
- Subscribe to RSS Feed
- Permalink
- Report Inappropriate Content
Hi Gysbert,
very cool idea to solve the issue.
Thanks - it's really great and I will use it for the moment as a "workaround". You know why it's not completely working for me? Because if I add another dimension, to display the Sales for each customer in a stacked bar, then the X-Axis "Legend" (Text on Axis) is displayed multiple times.
Thanks so much for the nice way to get this solved somehow,
Regards
Mathias