Unlock a world of possibilities! Login now and discover the exclusive benefits awaiting you.
- Qlik Community
- :
- All Forums
- :
- QlikView App Dev
- :
- Re: How to create subtotals for a calculated dimen...
- Subscribe to RSS Feed
- Mark Topic as New
- Mark Topic as Read
- Float this Topic for Current User
- Bookmark
- Subscribe
- Mute
- Printer Friendly Page
- Mark as New
- Bookmark
- Subscribe
- Mute
- Subscribe to RSS Feed
- Permalink
- Report Inappropriate Content
Subtotals for a calculated dimension?
Spent a few days and couldn't find a solution -- your help is much appreciated.
Data fields: Type, Product, Qty
PIVOT TABLE
Dimensions:
=Type
=if(aggr(sum(Qty),Product,Type)>500, '>500','<500') /* labelled as Group
Expressions:
=Sum(Qty)
Calculated dimension is grouping for Products with Sum(Qty)>500 and <500.
Question: How to get subtotals for the calculated dimension to calculate percentage ?
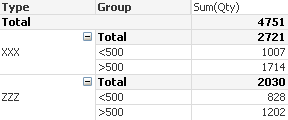
This is the table I have:
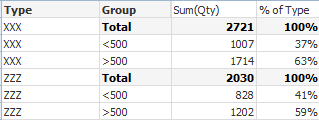
This is the table I need to get:
Problem is not that so trivial as it seems -- try to play with the application (attached).
Thanks!
Accepted Solutions
- Mark as New
- Bookmark
- Subscribe
- Mute
- Subscribe to RSS Feed
- Permalink
- Report Inappropriate Content
OK, here is the answer. Works like a charm with any number of rows in a calculated dimension, and without any additional data structures.
=sum(Qty)/rangesum(top(Sum(Qty),1,NoOfRows()))
- Mark as New
- Bookmark
- Subscribe
- Mute
- Subscribe to RSS Feed
- Permalink
- Report Inappropriate Content
Hi Dmitry,
In [% of Type] Expression try with this
=NUM(Sum(Qty) / (IF(ISNULL(AGGR(SUM(Qty),Type)),ABOVE(AGGR(SUM(Qty),Type)),AGGR(SUM(Qty),Type))),'00%')
Do let me know, if you looking for this one.
Regards,
Sokkorn
- Mark as New
- Bookmark
- Subscribe
- Mute
- Subscribe to RSS Feed
- Permalink
- Report Inappropriate Content
Thanks, Sokkorn -- it works exactly as needed.
BTW, never knew about chart inter record functions -- very helpful.
- Mark as New
- Bookmark
- Subscribe
- Mute
- Subscribe to RSS Feed
- Permalink
- Report Inappropriate Content
This solution works well if there are only two values in Group. What about more flexible solution -- when it could be any number of values in group?
Actually what is needed is to aggregate over a calculated dimension.
Message was edited by: Dmitry Gudkov
- Mark as New
- Bookmark
- Subscribe
- Mute
- Subscribe to RSS Feed
- Permalink
- Report Inappropriate Content
Hi, Dmitry
You can use valuelist('<500','>500') in calculated dimension. And the same in the expression: if(valuelist('<500','>500')='<500',.....)
BR,
Konstantins
- Mark as New
- Bookmark
- Subscribe
- Mute
- Subscribe to RSS Feed
- Permalink
- Report Inappropriate Content
Hi Dmitry,
Try to load data like this
[Data1]:
LOAD * INLINE [
Type,Product,Qty
XXX,A,13
XXX,A,34
XXX,A,123
XXX,A,325
XXX,B,13
XXX,B,34
XXX,B,123
XXX,B,325
XXX,C,34
XXX,C,123
XXX,C,325
XXX,C,453
XXX,D,4
XXX,D,13
XXX,E,325
XXX,E,454
ZZZ,A,45
ZZZ,A,56
ZZZ,A,65
ZZZ,B,45
ZZZ,B,435
ZZZ,C,45
ZZZ,C,65
ZZZ,C,435
ZZZ,C,657
ZZZ,D,5
ZZZ,D,34
ZZZ,D,45
ZZZ,E,45
ZZZ,E,53
];
[Data2]:
LOAD *,
IF([TotalQty]>500, '>500',
IF([TotalQty]<=500 AND [TotalQty]>=400,'400-500','<400')) AS [Range];
LOAD
Type &' - '& Product AS [Key],
SUM(Qty) AS [TotalQty]
RESIDENT [Data1] GROUP BY Type &' - '& Product;
Then use the second table to do with business need.
This one just an idea to solve your problem. It not reply to your issue yet. So we need to do more on it. Will reply you back when I'm in office.
Hope this help.
Regards,
Sokkorn
- Mark as New
- Bookmark
- Subscribe
- Mute
- Subscribe to RSS Feed
- Permalink
- Report Inappropriate Content
Sokkorn,
Thanks for helping me. This sample application is just a representation of the problem. Actual application is much more complex and table data changes dynamically, so additional static data structures barely help here.
Probably I should find a way how to get rid of the calculated dimension, like konstantins advised.
- Mark as New
- Bookmark
- Subscribe
- Mute
- Subscribe to RSS Feed
- Permalink
- Report Inappropriate Content
Hi Dmitry,
Check my sample attached file.
Regards,
Sokkorn
- Mark as New
- Bookmark
- Subscribe
- Mute
- Subscribe to RSS Feed
- Permalink
- Report Inappropriate Content
OK, here is the answer. Works like a charm with any number of rows in a calculated dimension, and without any additional data structures.
=sum(Qty)/rangesum(top(Sum(Qty),1,NoOfRows()))