Unlock a world of possibilities! Login now and discover the exclusive benefits awaiting you.
- Qlik Community
- :
- All Forums
- :
- QlikView App Dev
- :
- Sum of Distinct Records
- Subscribe to RSS Feed
- Mark Topic as New
- Mark Topic as Read
- Float this Topic for Current User
- Bookmark
- Subscribe
- Mute
- Printer Friendly Page
- Mark as New
- Bookmark
- Subscribe
- Mute
- Subscribe to RSS Feed
- Permalink
- Report Inappropriate Content
Sum of Distinct Records
Hi
Below is the sample data
| Date | MAR | vTAT |
| 2015-04-24 | 150424SCBLAU2SAXXX4495866032 | 1:13:41 |
| 2015-04-24 | 150424SCBLAU2SBXXX0123004002 | 63:41:27 |
| 2015-04-24 | 150424SCBLAU2SAXXX4495866033 | 65:52:23 |
| 2015-04-24 | 150424SCBLAU2SBXXX0123004002 | 63:41:27 |
| 2015-04-24 | 150424SCBLAU2SBXXX0123004002 | 63:41:27 |
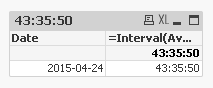
Need to find the average of vTAT for DISTINCT MAR using Date as Dimension
Average should be around 43:35:50
It should be displayed as a BAR CHART
Regards
- Mark as New
- Bookmark
- Subscribe
- Mute
- Subscribe to RSS Feed
- Permalink
- Report Inappropriate Content
May be this:
=Avg(Aggr(Avg(vTAT), MAR))
- Mark as New
- Bookmark
- Subscribe
- Mute
- Subscribe to RSS Feed
- Permalink
- Report Inappropriate Content
Test and confirm
- Mark as New
- Bookmark
- Subscribe
- Mute
- Subscribe to RSS Feed
- Permalink
- Report Inappropriate Content
Please find attached a sample application with the desired output:

- Mark as New
- Bookmark
- Subscribe
- Mute
- Subscribe to RSS Feed
- Permalink
- Report Inappropriate Content
Hi
Below is my Requirement
Dimension - > Date
Need to find the average of Time Diff between EndDate and Start Date for Distinct MAR
In the Attached file the average should be 45:35:50
Note: Source file attached as excel in Distinct Sum
Regards,
Senthil