Unlock a world of possibilities! Login now and discover the exclusive benefits awaiting you.
- Qlik Community
- :
- All Forums
- :
- QlikView App Dev
- :
- Sum of Rolling 12 months for each month, 2 lines f...
- Subscribe to RSS Feed
- Mark Topic as New
- Mark Topic as Read
- Float this Topic for Current User
- Bookmark
- Subscribe
- Mute
- Printer Friendly Page
- Mark as New
- Bookmark
- Subscribe
- Mute
- Subscribe to RSS Feed
- Permalink
- Report Inappropriate Content
Sum of Rolling 12 months for each month, 2 lines for selected & previous years
Hello,
I am trying to create a line chart with:
1 line: rolling 12 months for selected year & month
2 line: rolling 12 months for the year previous to selected year
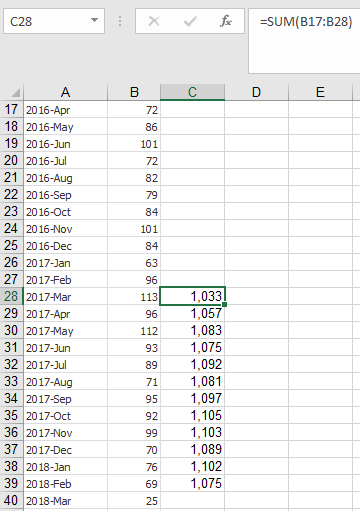
& when I say rolling, the value for each month is an accumulation of previous 12 months. Col C in the below picture is what I would like to see on the chart when I select Year=2018 & Month=Feb.
As mentioned, when I make the above selection I should have
1 line: feb 2018 to mar 2017
2 line: feb 2017 to mar 2016
- Mark as New
- Bookmark
- Subscribe
- Mute
- Subscribe to RSS Feed
- Permalink
- Report Inappropriate Content
I replaced 'Year_Month' with 'Month' for the 1st parameter in Dual, it works now.
Thank you very much.
- Mark as New
- Bookmark
- Subscribe
- Mute
- Subscribe to RSS Feed
- Permalink
- Report Inappropriate Content
Awesome 
- Mark as New
- Bookmark
- Subscribe
- Mute
- Subscribe to RSS Feed
- Permalink
- Report Inappropriate Content
Sunny,
Is it possible to use getfieldselection in place of "2017" in your expression? So that it's dynamic.
=RangeSum(Above(Count({<Year, Month=, Year_Month, Week= , Complaint_Type_Description={'Customer'}>}DISTINCT Complaint_Number), 0, 12)) * Avg({<Month,Year = {'2017'}>} 1)
I tried with the below script, doesn't work.
Year={'$(=getfieldselections(Year))'}
- Mark as New
- Bookmark
- Subscribe
- Mute
- Subscribe to RSS Feed
- Permalink
- Report Inappropriate Content
Sure... try this
=RangeSum(Above(Count({<Year, Month=, Year_Month, Week= ,Complaint_Type_Description={'Customer'}>}DISTINCT Complaint_Number), 0, 12)) *Avg({<Month,Year = {$(=Max(Year))}>} 1)
- Mark as New
- Bookmark
- Subscribe
- Mute
- Subscribe to RSS Feed
- Permalink
- Report Inappropriate Content
It turned out into this-
I tried it on your QVW too, its giving me the same result.
- Mark as New
- Bookmark
- Subscribe
- Mute
- Subscribe to RSS Feed
- Permalink
- Report Inappropriate Content
Not seeing the problem
It would be nice if you show the changes you make by reposting the qvw by making your changes so that we can see what you might be doing. Anyways... PFA
- Mark as New
- Bookmark
- Subscribe
- Mute
- Subscribe to RSS Feed
- Permalink
- Report Inappropriate Content
Ok, Let me try again and will get back to you. Thank you.
- Mark as New
- Bookmark
- Subscribe
- Mute
- Subscribe to RSS Feed
- Permalink
- Report Inappropriate Content
Hi Sunny,
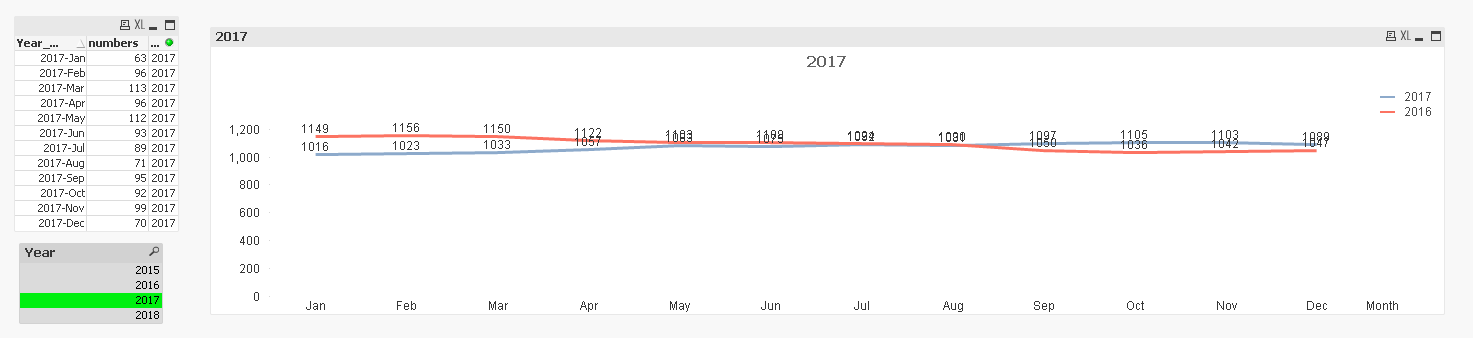
Now the chart is changing dynamically based on Year selection. However, I've encountered another problem now -
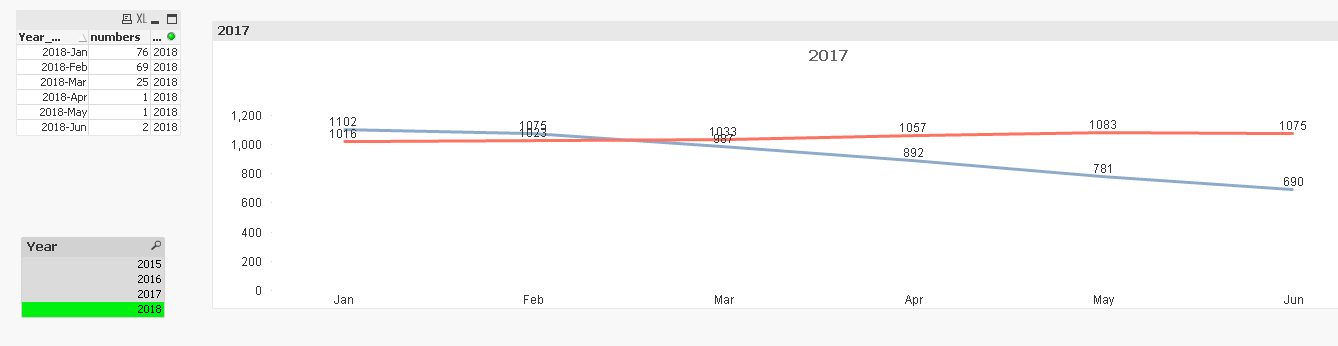
when I choose 2018, since we have data only till June, even for 2017 it is showing only until June.
Thank you.
- Mark as New
- Bookmark
- Subscribe
- Mute
- Subscribe to RSS Feed
- Permalink
- Report Inappropriate Content
when I choose 2018, since we have data only till June, even for 2017 it is showing only until June.
I agree... but how is that a problem
- Mark as New
- Bookmark
- Subscribe
- Mute
- Subscribe to RSS Feed
- Permalink
- Report Inappropriate Content
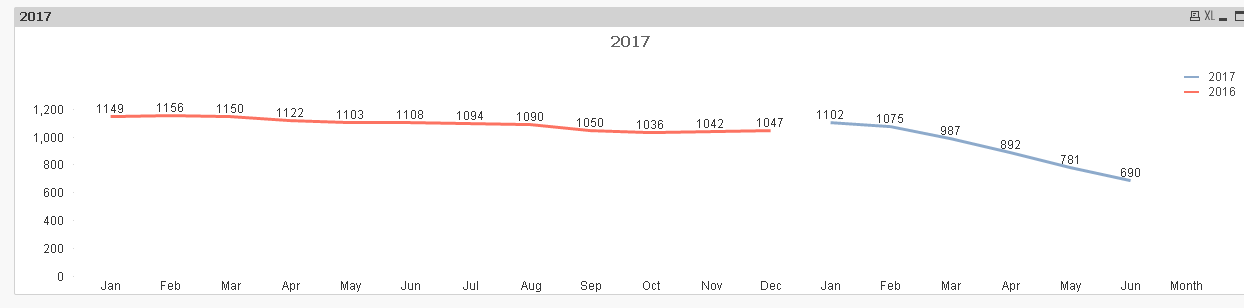
But for 2017, we have data until Dec. Is it possible to display current year till date and previous year until Dec when 2018 is selected?