Unlock a world of possibilities! Login now and discover the exclusive benefits awaiting you.
- Qlik Community
- :
- All Forums
- :
- QlikView App Dev
- :
- Re: Sum of Rolling 12 months for each month, 2 lin...
- Subscribe to RSS Feed
- Mark Topic as New
- Mark Topic as Read
- Float this Topic for Current User
- Bookmark
- Subscribe
- Mute
- Printer Friendly Page
- Mark as New
- Bookmark
- Subscribe
- Mute
- Subscribe to RSS Feed
- Permalink
- Report Inappropriate Content
Sum of Rolling 12 months for each month, 2 lines for selected & previous years
Hello,
I am trying to create a line chart with:
1 line: rolling 12 months for selected year & month
2 line: rolling 12 months for the year previous to selected year
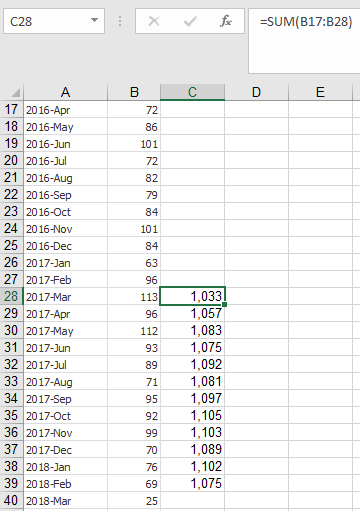
& when I say rolling, the value for each month is an accumulation of previous 12 months. Col C in the below picture is what I would like to see on the chart when I select Year=2018 & Month=Feb.
As mentioned, when I make the above selection I should have
1 line: feb 2018 to mar 2017
2 line: feb 2017 to mar 2016
- Mark as New
- Bookmark
- Subscribe
- Mute
- Subscribe to RSS Feed
- Permalink
- Report Inappropriate Content
thanks
- Mark as New
- Bookmark
- Subscribe
- Mute
- Subscribe to RSS Feed
- Permalink
- Report Inappropriate Content
Can be done with The As-Of Table like you mentioned... but here is one option without using As Of Table
- Mark as New
- Bookmark
- Subscribe
- Mute
- Subscribe to RSS Feed
- Permalink
- Report Inappropriate Content
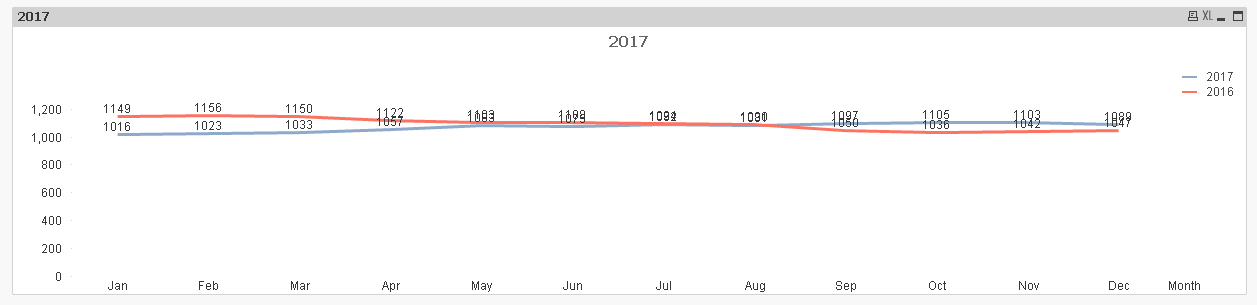
You can deceive the chart label using Dual function
=Dual(Month(Year_Month), Year_Month)
- Mark as New
- Bookmark
- Subscribe
- Mute
- Subscribe to RSS Feed
- Permalink
- Report Inappropriate Content
I see.. the trick behind Above(rangesum(above(... is that it rollback 24 months ?
- Mark as New
- Bookmark
- Subscribe
- Mute
- Subscribe to RSS Feed
- Permalink
- Report Inappropriate Content
Yes
- Mark as New
- Bookmark
- Subscribe
- Mute
- Subscribe to RSS Feed
- Permalink
- Report Inappropriate Content
a bit complicated to understand.. was trying the same approach creating a field with autonumber(year_month) and using it inside a range set analysis ( >=max()-24 <=max() ) inside the sum.. didn't work..
- Mark as New
- Bookmark
- Subscribe
- Mute
- Subscribe to RSS Feed
- Permalink
- Report Inappropriate Content
Hi Sunny,
That's fantastic, thank you.
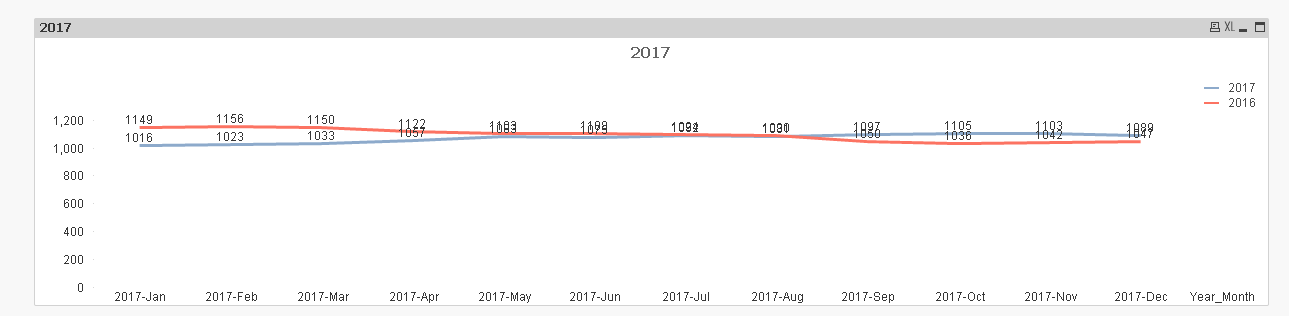
Do you have an idea as to why the months are showing up as below?

- Mark as New
- Bookmark
- Subscribe
- Mute
- Subscribe to RSS Feed
- Permalink
- Report Inappropriate Content
Is this how you see it when you open my attached file?
- Mark as New
- Bookmark
- Subscribe
- Mute
- Subscribe to RSS Feed
- Permalink
- Report Inappropriate Content
No, that's what I see when I implement the same in the original report that I am working on.
- Mark as New
- Bookmark
- Subscribe
- Mute
- Subscribe to RSS Feed
- Permalink
- Report Inappropriate Content
Well, I have no idea what you have... can you share a sample?