Unlock a world of possibilities! Login now and discover the exclusive benefits awaiting you.
- Qlik Community
- :
- All Forums
- :
- QlikView App Dev
- :
- Re: Sum of a 'lookup' list when a filter on anothe...
- Subscribe to RSS Feed
- Mark Topic as New
- Mark Topic as Read
- Float this Topic for Current User
- Bookmark
- Subscribe
- Mute
- Printer Friendly Page
- Mark as New
- Bookmark
- Subscribe
- Mute
- Subscribe to RSS Feed
- Permalink
- Report Inappropriate Content
Sum of a 'lookup' list when a filter on another table excludes it
Hi,
Lets say I have two tables, "Births" and "Population"
The Births table contains details of births, together with the age of the mother, grouped into 5 year segments i.e. 15-19,20-24,25-29 in the field FIVE_YEAR_AGE_BAND. There is also the gender of the baby - Male,Female in the field BABY_GENDER
This links across to another table on FIVE_YEAR_AGE_BAND and MOTHER_GENDER in order to get the population list size for that age band/gender.
I want to calculate the birth rate per 1000 population, so (sum of births / sum of population) * 1000
Everything is good, but if a user wishes to select 3 age bands, like the 15-19,20-24 and 25-29 as above, and a BABY_GENDER of Male, the list size is only the sum of list sizes which have a birth against them - the population for the excluded isn't counted.
In the example I have selected everything as above and the list size 'technically' 113 as per the data model, but I am after 141, including the list size of 28 for the age range 20-24 which is excluded as there was no birth in that group with a BABY_GENDER of Male. Is there a way to include it? This is a relatively simple example, in reality, there are lots of other filters which could narrow the activity, but crucially, if the user has selected any FIVE_YEAR_AGE_BAND, I want the sum of the selected populations (in the chart) - but it is made a bit more complex because in my real development there are other dimensions which I still want honouring - by that I can't just use {1<FIVE_YEAR_AGE_BAND=<enter variable that concatenate all selected age ranges>} because the 1 would include a raft of other age sizes for other doctors surgeries.
I've messed with +P()+E() and other crazy set analysis but can't seem to crack it.
Example attached.
Many thanks, Dan.
- Mark as New
- Bookmark
- Subscribe
- Mute
- Subscribe to RSS Feed
- Permalink
- Report Inappropriate Content
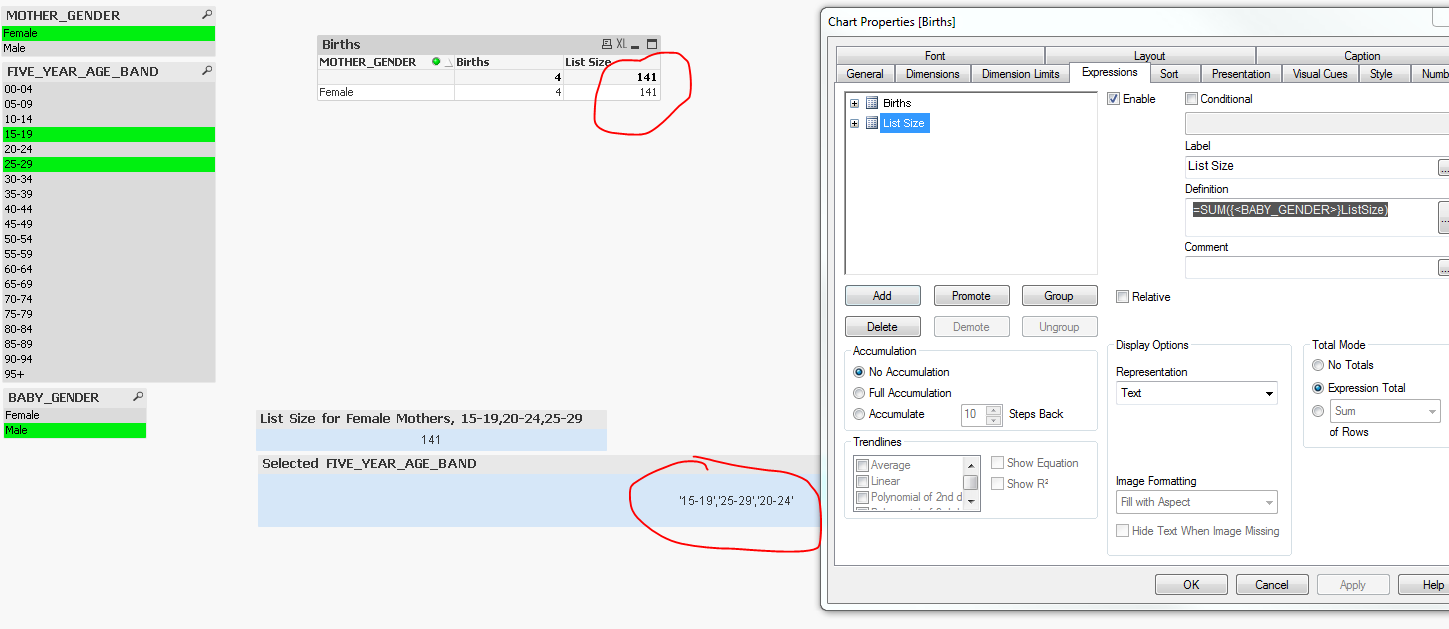
May be exclude selection is BABY_GENDER here
=SUM({<BABY_GENDER>}ListSize)
- Mark as New
- Bookmark
- Subscribe
- Mute
- Subscribe to RSS Feed
- Permalink
- Report Inappropriate Content
Hi Sunny,
Thanks for your knowledgeable response. Indeed, that works in the situation I gave, but I've given it more thought and my example doesn't cover the issue I'm finding
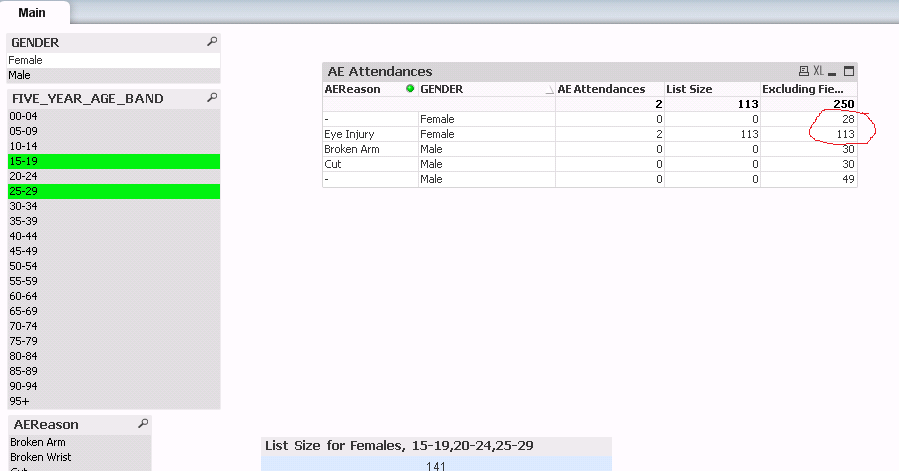
I've re-done it so that instead of births, we have A&E Attendances at hospital. The two tables now link on GENDER and FIVE_YEAR_AGE_BAND.
In my chart, I want to use AEReason and GENDER to get a count of attendances divided by the age range(s) selected. I can't get the 141 in both 'Female' rows using the method you suggested. Any ideas?
Thanks a lot
Dan
- Mark as New
- Bookmark
- Subscribe
- Mute
- Subscribe to RSS Feed
- Permalink
- Report Inappropriate Content
How about the Male? The number for Male part are going to stay the same or change? If they will stay the same, then what is the reason that Female changes, but Male doesn't? If they change, what is the new expected number for Male?
- Mark as New
- Bookmark
- Subscribe
- Mute
- Subscribe to RSS Feed
- Permalink
- Report Inappropriate Content
Hi Sunny
The male should be the sum of the selected Male range too  Sorry, I'm just focusing on female to keep it simple, but I'm after 1 row of 141 for female and 2 rows of 109 for male
I hope that makes sense
Thanks
Dan
- Mark as New
- Bookmark
- Subscribe
- Mute
- Subscribe to RSS Feed
- Permalink
- Report Inappropriate Content
Maybe
=SUM(TOTAL< GENDER> {<AEReason>} ListSize)
edit: or maybe
=Sum({<AEReason = {"*"}>} Aggr( SUM(TOTAL< GENDER> {<AEReason = >} ListSize), AEReason, GENDER))
| AEReason | GENDER | AE Attendances | Excluding Fields List Size |
|---|---|---|---|
| 2 | 359 | ||
| Broken Arm | Male | 0 | 109 |
| Cut | Male | 0 | 109 |
| Eye Injury | Female | 2 | 141 |