Unlock a world of possibilities! Login now and discover the exclusive benefits awaiting you.
- Qlik Community
- :
- All Forums
- :
- QlikView App Dev
- :
- Re: Sum of all values of a field
- Subscribe to RSS Feed
- Mark Topic as New
- Mark Topic as Read
- Float this Topic for Current User
- Bookmark
- Subscribe
- Mute
- Printer Friendly Page
- Mark as New
- Bookmark
- Subscribe
- Mute
- Subscribe to RSS Feed
- Permalink
- Report Inappropriate Content
Sum of all values of a field
Hello everyone,
I am asking your help about how can I automatically doing the count of lines of all the values of a field, to display it by percent.
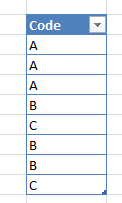
For exemple, I have my field Code :
And the result is a chart, with the sum of lines with A, lines with B and lines with C, for a total of 100% :
![]()
Do you know if it is possible ?
Hope I was understandable.
Thanks !
- Mark as New
- Bookmark
- Subscribe
- Mute
- Subscribe to RSS Feed
- Permalink
- Report Inappropriate Content
Add an expression with Count (YourField) / Count (TOTAL YourField)
- Mark as New
- Bookmark
- Subscribe
- Mute
- Subscribe to RSS Feed
- Permalink
- Report Inappropriate Content
You can use stacked bar chart. If 'Code' is you only dimension, add dummy dimension before it.
- Mark as New
- Bookmark
- Subscribe
- Mute
- Subscribe to RSS Feed
- Permalink
- Report Inappropriate Content
Thanks for you responses.
I think I will do that.
Create all the expressions and use the stacked bar.
The only thing is that it will not be optimized when adding new values in the fields.
See you 
- Mark as New
- Bookmark
- Subscribe
- Mute
- Subscribe to RSS Feed
- Permalink
- Report Inappropriate Content
try this 100% chart
sum(fabs(COMMENROLL_ENROLLTYPE_GRP_COUNT))
/sum(total <COMMENROLL_ENROLLTYPE_DATE> fabs(COMMENROLL_ENROLLTYPE_GRP_COUNT))