Unlock a world of possibilities! Login now and discover the exclusive benefits awaiting you.
- Qlik Community
- :
- All Forums
- :
- QlikView App Dev
- :
- Sum of expression
- Subscribe to RSS Feed
- Mark Topic as New
- Mark Topic as Read
- Float this Topic for Current User
- Bookmark
- Subscribe
- Mute
- Printer Friendly Page
- Mark as New
- Bookmark
- Subscribe
- Mute
- Subscribe to RSS Feed
- Permalink
- Report Inappropriate Content
Sum of expression
Hi,
I have a table which few dimensions and few expressions on it. Within the table only one dimension column is visible and others are hidden. With applying Sum of Expressions I get total of expression column which is grouping expression with all fields (example given below).
Branch (Dim), Increase (Exp.), RI (Exp.)
6 , 100%
ABC , 1 , 11.2%
ABC , 0 , -10.1%
ABC , 1 , 5.2%
XYZ , 0 , 23.5%
XYZ , 1 , 10.2%
CDE , 1 , 12.1%
CDE , 1 , 10.2%
CDE , 0 , 13.1%
GHJ , 1 , 11.2%
GHJ , 0 , 4.5%
GHJ , 1 , 10.6%
The reason why Branch names are repeated is because there are other columns which are hidden. The expression for column Increase is =if (RI <= 2.5/1000,1,0). Please note the example above & below has hypothetical numbers.
I want to show a table with distinct values with expressions as above but still grouping it with other hidden columns, like below.
Branch (Dim), Increase (Exp.), RI (Exp.)
6 , 100%
ABC , 2 , 14.2%
XYZ , 1 , 13.5%
CDE , 2 , 12.1%
GHJ , 2 , 11.2%
The table still needs to split the expression figures by other columns but it should show one line per Branch.
Is this possible? Any help will be very much appreciated.
Thanks in advance!!
Accepted Solutions
- Mark as New
- Bookmark
- Subscribe
- Mute
- Subscribe to RSS Feed
- Permalink
- Report Inappropriate Content
Try this expression for Increase
=Sum(Aggr(if(sum([Rate Increase]) >=2.5/1000,1,0), Branch, POL_NO, RISK_CLASS, PREMIUM_CLASS, LOCATION, RISK_NO))
- Mark as New
- Bookmark
- Subscribe
- Mute
- Subscribe to RSS Feed
- Permalink
- Report Inappropriate Content
Hi,
Try with : aggr(Sum(Increase),Branch)
- Mark as New
- Bookmark
- Subscribe
- Mute
- Subscribe to RSS Feed
- Permalink
- Report Inappropriate Content
Hi,
Can you attach sample file with hidden columns.
I think we can use Aggregation function to Achieve it.
- Mark as New
- Bookmark
- Subscribe
- Mute
- Subscribe to RSS Feed
- Permalink
- Report Inappropriate Content
Hi,
You can Use something Like this:
=Aggr(Sum(Expression),Branch,other dimensions( Hidden Dimensions)
Thanks,
Mukram
- Mark as New
- Bookmark
- Subscribe
- Mute
- Subscribe to RSS Feed
- Permalink
- Report Inappropriate Content
Why add dimension and hide them if they are not serving any purpose?
- Mark as New
- Bookmark
- Subscribe
- Mute
- Subscribe to RSS Feed
- Permalink
- Report Inappropriate Content
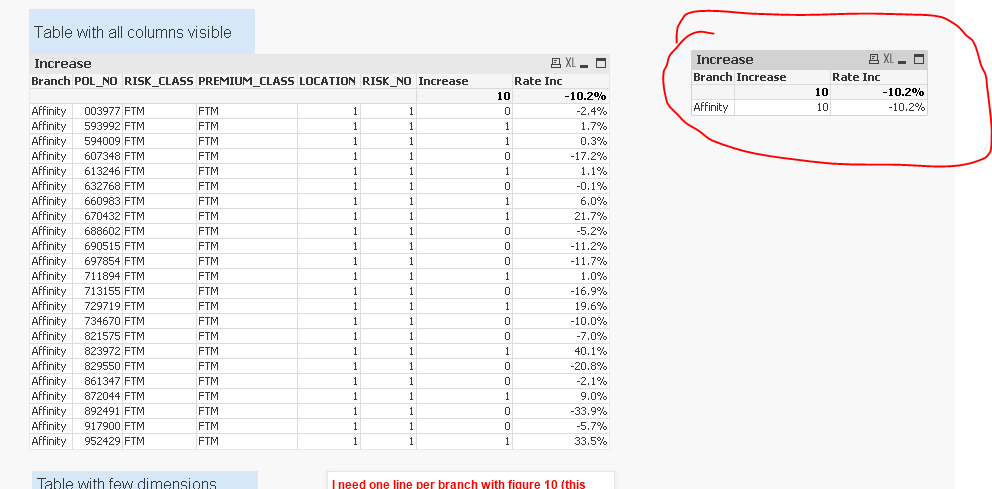
The hidden dimensions are needed to calculate the Increase expressions. The figure 10 shown at the top of Increase column is "Sum of Rows" and not "Expression Total"
- Mark as New
- Bookmark
- Subscribe
- Mute
- Subscribe to RSS Feed
- Permalink
- Report Inappropriate Content
Hi sample file is attached now. This is showing the problem I am facing and the expected outcome.
- Mark as New
- Bookmark
- Subscribe
- Mute
- Subscribe to RSS Feed
- Permalink
- Report Inappropriate Content
Try this expression for Increase
=Sum(Aggr(if(sum([Rate Increase]) >=2.5/1000,1,0), Branch, POL_NO, RISK_CLASS, PREMIUM_CLASS, LOCATION, RISK_NO))
- Mark as New
- Bookmark
- Subscribe
- Mute
- Subscribe to RSS Feed
- Permalink
- Report Inappropriate Content
Hi Sunny,
thanks a lot for this. this is working in the sample file you returned to me however the same is not working in actual document. Don't know why.
- Mark as New
- Bookmark
- Subscribe
- Mute
- Subscribe to RSS Feed
- Permalink
- Report Inappropriate Content
Hi Sunny,
The problem was I had put extra Sum due to which it wasn't working, but when I removed the extra Sum it gave me perfect result.
Thanks a ton!!!