Unlock a world of possibilities! Login now and discover the exclusive benefits awaiting you.
- Qlik Community
- :
- All Forums
- :
- QlikView App Dev
- :
- Sum of rows in pivot table
- Subscribe to RSS Feed
- Mark Topic as New
- Mark Topic as Read
- Float this Topic for Current User
- Bookmark
- Subscribe
- Mute
- Printer Friendly Page
- Mark as New
- Bookmark
- Subscribe
- Mute
- Subscribe to RSS Feed
- Permalink
- Report Inappropriate Content
Sum of rows in pivot table
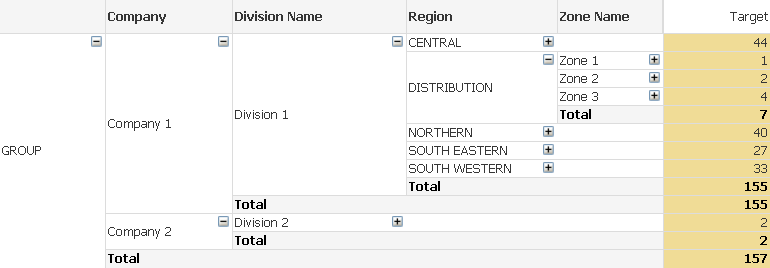
I've searched in this forum and haven't found my exact issue raised, wondering if this is possible: I have a pivot table which can be expanded at various nodes by the user and a Target column which is calculated based on existing data (does some rounding). They decide what level each Target needs to be calculated at, by expanding or collapsing dimensions. But I need the total rows to show the total of the lower level rows, not recalculate with rounding, as currently totals do not add up.
In the chart below, the total for Company 1 (and Division 1) should be 151, not 155. I played around with dimensionality() and aggr() but the formula will be different depending on what nodes have been expanded. Anyone know how I can do this?
- Mark as New
- Bookmark
- Subscribe
- Mute
- Subscribe to RSS Feed
- Permalink
- Report Inappropriate Content
Sorry yes that looks right, maybe I haven't uploaded the right data I will check again!
- Mark as New
- Bookmark
- Subscribe
- Mute
- Subscribe to RSS Feed
- Permalink
- Report Inappropriate Content
Karen Twemlow <span class="icon-status-icon icon-partner" title="Partner"></span> wrote:
Thanks Lisa, aggr() needs to pass the dimensions, I don't know what they will be as it's based upon the user expanding or collapsing the dimensions. For one total row, I'd need to identify what dimensions were expanded or collapsed in the records before it, and calculate at those dimensions then add up. Aggr() would work great if the pivot table was expanded consistently for all rows. But maybe there's something in aggr() that I'm missing?
Karen, I am not quite sure what you are after.
In an earlier post, you mentioned you want the totals to aggregate on the lowest level, not recalculate.
But then, you know the dimensions to use in the Aggr() function, in your example the expression would look like
=Sum(Aggr( round(sum(Count)*.9,1), Group,Company, Division, Region, Zone))
This will always show the same total values, regardless if you collaps or expand specific dimensional values.
The solution that Sunny suggested is much more complex and will change the totals if you collaps or expand them.
But this will show different 'truths' to the user, so personally I tend to find this confusing. I would rather leave the original plain round(sum()) expression and explain that there are rounding differences when summing lower granularity by hand.
But again, I don't have a real idea what you're after.
Regards,
Stefan
- Mark as New
- Bookmark
- Subscribe
- Mute
- Subscribe to RSS Feed
- Permalink
- Report Inappropriate Content
Yes that's right the numbers need to change depending on where the table is expanded. This is due to the rounding. Ie consider 100 low level rows, all with a value of 1 - we want to reduce these targets by 10% but since we can only report whole numbers, in this case we cannot change the target number for the low level numbers, it will remain as 1 for each row. If the business decides to report numbers at a higher level, the value for these rows is 100, so we can set a target of 90 at the higher level. The business will decide what level to set the targets at, mostly based on what these numbers look like.
- Mark as New
- Bookmark
- Subscribe
- Mute
- Subscribe to RSS Feed
- Permalink
- Report Inappropriate Content
Hi Sunny,
Just checked - we would actually expect 157 for Division 2 with rounding at that level. It appears to be doing an aggr() and then a sum. We don't want to do that since we have not expanded the Division 2 level. See in my original table, the value for Division 2 is 157. But in yours it is 156.
- Mark as New
- Bookmark
- Subscribe
- Mute
- Subscribe to RSS Feed
- Permalink
- Report Inappropriate Content
At this stage I'm reporting the data without any partial sums. The user is adding the total rows in Excel.
- Mark as New
- Bookmark
- Subscribe
- Mute
- Subscribe to RSS Feed
- Permalink
- Report Inappropriate Content
I do KNOW what dimensions are available to use in aggr() but I don't want to aggregate at that level if the table has not been expanded down to that level. The formula is setting a target value, it should change depending on the level expanded, due to rounding. We expect this and we want this.
If I remove partial sums, and just use my formula and the user expands each business area as required, they get the numbers they want. I then simply just want to add up those numbers - the numbers that are being displayed to the user.
Ie here, I want a total for Division 2 to be 157.

And below, if the user decides they want to do targets at a lower level for Region 4, they expand Region 4 and I want the total for Division 2 to now be 156.

I just basically want to sum up what is being displayed to the user, that's all. Sounds easy, but seems not possible?!
Note this is simplified data, there are many many more rows than I'm showing here plus a few more dimension levels.
- Mark as New
- Bookmark
- Subscribe
- Mute
- Subscribe to RSS Feed
- Permalink
- Report Inappropriate Content
You can use aggr to sum the row in pivot table
=SUM(AGGR(round(sum(Count)*.9,1),Group,Company,Division,Region,Zone))
- Mark as New
- Bookmark
- Subscribe
- Mute
- Subscribe to RSS Feed
- Permalink
- Report Inappropriate Content
I see the problem, but I don't think I have a solution to this problem. If only I can identify which rows are not total, I might be able to do this, but I tried various different options, including but not limited to
Max(TOTAL <> Dimensionality())
If something like this would have given me an output, we could have got what we wanted.... I am still hoping that swuehl might have a solution for you.
Best,
Sunny
- Mark as New
- Bookmark
- Subscribe
- Mute
- Subscribe to RSS Feed
- Permalink
- Report Inappropriate Content
Thanks but I don't want to aggregate down to Zone level if the user has not expanded to that level. I just want to sum the numbers that are being displayed. The numbers displayed are going to be different depending on what level has been expanded so totals need to change along with that.
- Mark as New
- Bookmark
- Subscribe
- Mute
- Subscribe to RSS Feed
- Permalink
- Report Inappropriate Content
Yes, that's what I was initially trying to do. I had hoped dimensionality() would tell me which were total rows but it doesn't. And I don't know how to do that. Can't believe this is so difficult :-).
Thank you so much for giving it a go!