Unlock a world of possibilities! Login now and discover the exclusive benefits awaiting you.
- Qlik Community
- :
- All Forums
- :
- QlikView App Dev
- :
- Re: Sum over unique rows in expression
- Subscribe to RSS Feed
- Mark Topic as New
- Mark Topic as Read
- Float this Topic for Current User
- Bookmark
- Subscribe
- Mute
- Printer Friendly Page
- Mark as New
- Bookmark
- Subscribe
- Mute
- Subscribe to RSS Feed
- Permalink
- Report Inappropriate Content
Sum over unique rows in expression
Hi all,
I want to calculate the percentage of stock that is obsolete in a gauge chart. I have two tables, one with the stock levels and one with sales.
The stock table looks as follows:
product stock obsolete
A 300 YES
B 200 NO
C 200 NO
D 300 NO
I also have the following sales table:
product sold
B 20
B 30
B 45
C 10
C 100
D 150
When I now calculate the sum in a graph expression, it contains many duplicates, I presume that this is the case due to Qlikview making the one-to-many relation between these tables (as expected in the rest of the dashboard, but not what I want here..).
The result here should be the sum of obsolete stock, divided by the total stock. In this case: 300/(300+200+200+300) = 30%.
I have been messing around with aggregate, total, distinct, sum, min, but I cannot seem to get it right..
Could anybody help me or point me in the right direction?
Thanks in advance,
Florian
- « Previous Replies
-
- 1
- 2
- Next Replies »
Accepted Solutions
- Mark as New
- Bookmark
- Subscribe
- Mute
- Subscribe to RSS Feed
- Permalink
- Report Inappropriate Content
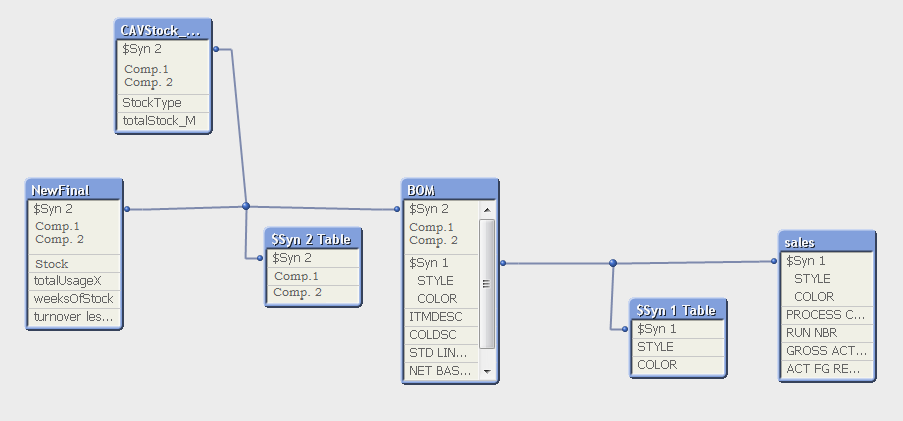
I would suggest you remove the synthetic keys as it will make your data model easier to understand and test. With the synethic keys removed you will be able to preview the tables correctly and see if the data associations are correct.
- Mark as New
- Bookmark
- Subscribe
- Mute
- Subscribe to RSS Feed
- Permalink
- Report Inappropriate Content
Try sum({<obsolete={'YES'}>}stock)/sum({1}total stock)
talk is cheap, supply exceeds demand
- Mark as New
- Bookmark
- Subscribe
- Mute
- Subscribe to RSS Feed
- Permalink
- Report Inappropriate Content
Thanks, this works! This was a simplified example of something that I was actually trying to achieve, in which it does not work yet. So I probably have to look at the structure of the data there. sum({1}total stock) returns a value that is way too high there..
- Mark as New
- Bookmark
- Subscribe
- Mute
- Subscribe to RSS Feed
- Permalink
- Report Inappropriate Content
Using the {1} set will mean that all data selections are ignored, which is why you are seeing a high figure.
Try this, so the same selection apply to both expressions.
sum({<obsolete={'YES'}>}stock) / sum(total stock)
- Mark as New
- Bookmark
- Subscribe
- Mute
- Subscribe to RSS Feed
- Permalink
- Report Inappropriate Content
The {1} makes the expression ignore all selections. If that's not what you need then try removing it.
talk is cheap, supply exceeds demand
- Mark as New
- Bookmark
- Subscribe
- Mute
- Subscribe to RSS Feed
- Permalink
- Report Inappropriate Content
Thanks again for your suggestions, but I think I am doing something more fundamental wrong. Both sum({1}total stock) and sum(total stock) return a value that is about 320 times as high as the total stock actually is. Exporting the table (product, stock) to excel shows that the sum should be around 50.000, while the sum({1}total stock) returns something like 13.000.000.
- Mark as New
- Bookmark
- Subscribe
- Mute
- Subscribe to RSS Feed
- Permalink
- Report Inappropriate Content
What do you get from this expression?
sum({<obsolete={'YES'}>}stock) / sum(stock)
- Mark as New
- Bookmark
- Subscribe
- Mute
- Subscribe to RSS Feed
- Permalink
- Report Inappropriate Content
Just sum(stock) gives a value of about 20.000, which is too low. I have attached my data structure, maybe that gives you an idea of why these strange values are returned? If I create a table of 'newFinal', I get exactly the information I expect, and the total of the stock column is about 50.000 there, which is the value it should be.
Also, by making a selection, the value for sum(stock) can actually become higher?
- Mark as New
- Bookmark
- Subscribe
- Mute
- Subscribe to RSS Feed
- Permalink
- Report Inappropriate Content
I would suggest you remove the synthetic keys as it will make your data model easier to understand and test. With the synethic keys removed you will be able to preview the tables correctly and see if the data associations are correct.
- Mark as New
- Bookmark
- Subscribe
- Mute
- Subscribe to RSS Feed
- Permalink
- Report Inappropriate Content
Thanks for this tip! I managed to find the mistake in my document. I forgot to add 'distinct' to a load, where I should have added it. This caused some combinations to show up more than once in a table, but not in the table box.
Thanks to you both for the help.
- « Previous Replies
-
- 1
- 2
- Next Replies »