Unlock a world of possibilities! Login now and discover the exclusive benefits awaiting you.
- Qlik Community
- :
- All Forums
- :
- QlikView App Dev
- :
- Sum plus selection
- Subscribe to RSS Feed
- Mark Topic as New
- Mark Topic as Read
- Float this Topic for Current User
- Bookmark
- Subscribe
- Mute
- Printer Friendly Page
- Mark as New
- Bookmark
- Subscribe
- Mute
- Subscribe to RSS Feed
- Permalink
- Report Inappropriate Content
Sum plus selection
HI, i have a query which looks like this:
SELECT DATE(c.date_register) AS DATECAST, COUNT(c.id) AS customers
FROM customer c
GROUP BY DATE(c.date_register)
it gives me the number of new customers per date.
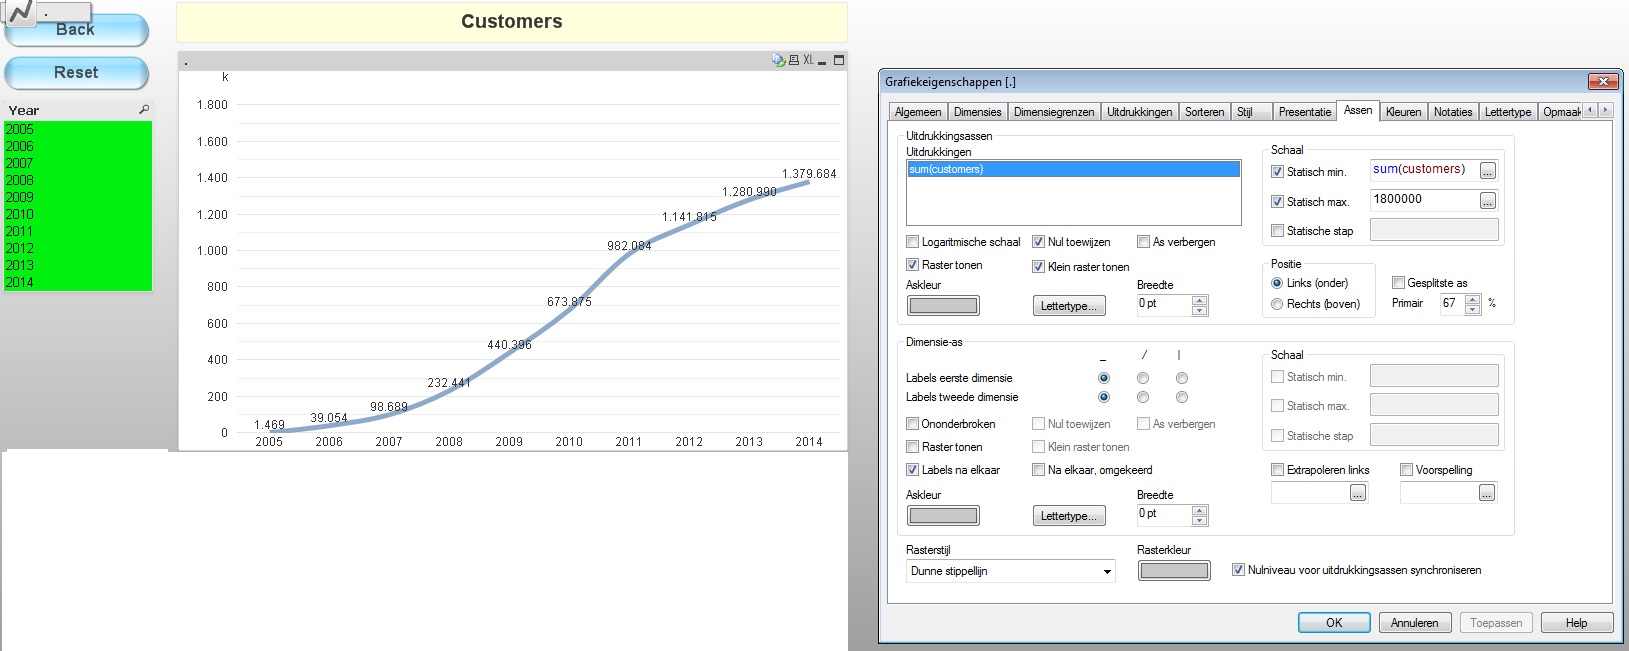
Now i want a chart, where i have on the left a selection of years, and in the graph the sum of the customers.
I managed to do this, but only i have 1 problem:
For example: when i select the years 2013 and 2014 in a list, i want the graph to start with the sum of customers until 2013, and then add the sum of customers for the years i selected (2013 and 2014), per year.
thanks!!!
- Tags:
- new_to_qlikview
- sum
- Mark as New
- Bookmark
- Subscribe
- Mute
- Subscribe to RSS Feed
- Permalink
- Report Inappropriate Content
HI,
I'd use a set analysis syntax like
sum({<Year={"<$(=vMinYear)"}>} Customers) + sum(Customers)
where vMinYear = Min(Year) as a Variable.
Hope it helps