Unlock a world of possibilities! Login now and discover the exclusive benefits awaiting you.
- Qlik Community
- :
- All Forums
- :
- QlikView App Dev
- :
- Sum till month ignoring month as dimension
- Subscribe to RSS Feed
- Mark Topic as New
- Mark Topic as Read
- Float this Topic for Current User
- Bookmark
- Subscribe
- Mute
- Printer Friendly Page
- Mark as New
- Bookmark
- Subscribe
- Mute
- Subscribe to RSS Feed
- Permalink
- Report Inappropriate Content
Sum till month ignoring month as dimension
Hi All,
I need urgent help regarding the problem:
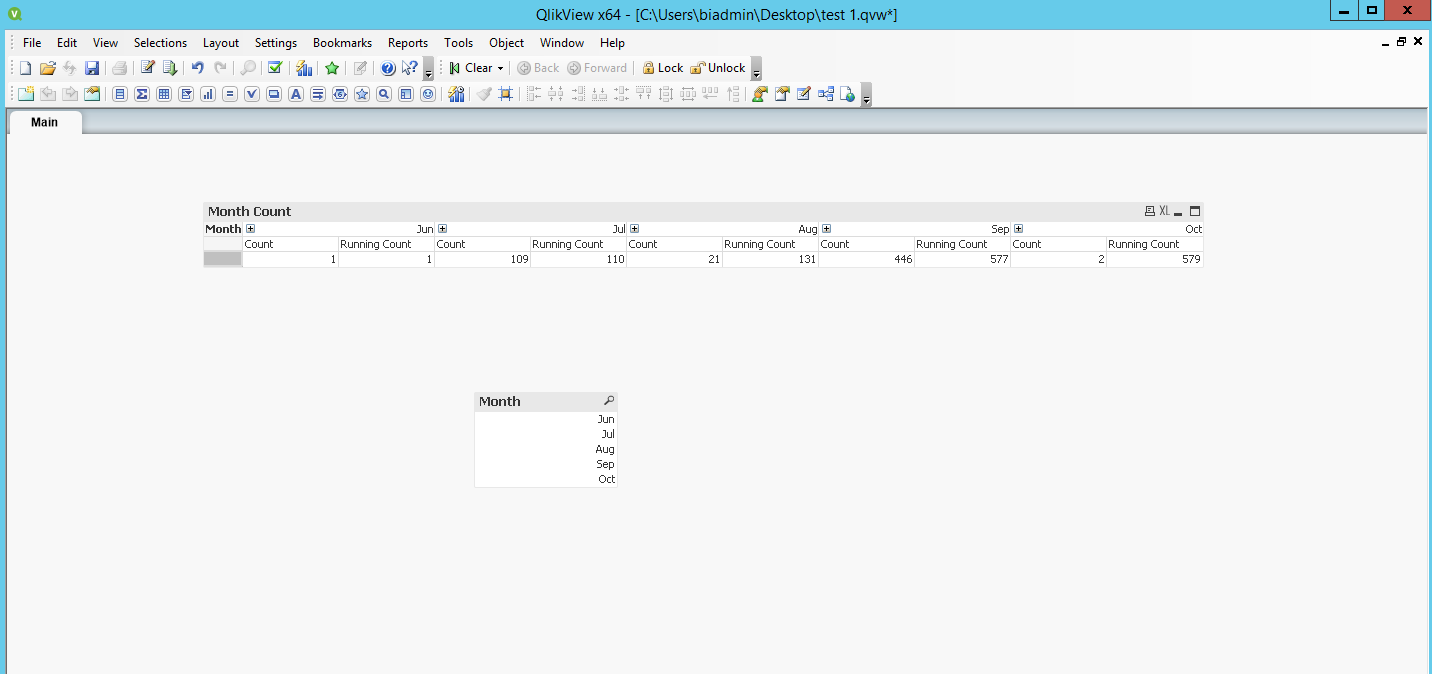
I have count of IDs which i have to show monthwise where month is my dimension. Since i have to show month as horizontal dimensioni have pulled it on the top of pivot chart.
Attached is the sample data
Lets say if for June my count if IDs are 109 and for Aug it is 22. then the chart should show 109 under July and 124 under Aug since the ID may get duplicated in both the months. Hence need to take only distinct count till the month in dimension.
- « Previous Replies
-
- 1
- 2
- Next Replies »
Accepted Solutions
- Mark as New
- Bookmark
- Subscribe
- Mute
- Subscribe to RSS Feed
- Permalink
- Report Inappropriate Content
May be use The As-Of Table here
- Mark as New
- Bookmark
- Subscribe
- Mute
- Subscribe to RSS Feed
- Permalink
- Report Inappropriate Content
May be use The As-Of Table here
- Mark as New
- Bookmark
- Subscribe
- Mute
- Subscribe to RSS Feed
- Permalink
- Report Inappropriate Content
I have around 10 columns in the chart and this logic is needed just for one expression. If i take AS-Of-Month as dimension it will greatly impact rest of the other expressions.
- Mark as New
- Bookmark
- Subscribe
- Mute
- Subscribe to RSS Feed
- Permalink
- Report Inappropriate Content
I think it will give a much better performance compared to any alternative front end solution you will use for this particular expression where you are looking to accumulate over time.
- Mark as New
- Bookmark
- Subscribe
- Mute
- Subscribe to RSS Feed
- Permalink
- Report Inappropriate Content
Thanks.
But i need accumulation only for one expression. Rest of the expressions are straight forward.
- Mark as New
- Bookmark
- Subscribe
- Mute
- Subscribe to RSS Feed
- Permalink
- Report Inappropriate Content
first load distinct id for each month then use full accumulation in chart.
RangeSum (above(sum(IDs),0,RowNo()))
- Mark as New
- Bookmark
- Subscribe
- Mute
- Subscribe to RSS Feed
- Permalink
- Report Inappropriate Content
Since the dimension is horizontal above() doesn't work here.
Have tried with before but it doesnot give me count till date. Rather gave count for that month
- Mark as New
- Bookmark
- Subscribe
- Mute
- Subscribe to RSS Feed
- Permalink
- Report Inappropriate Content
Hi Saima,
Had to make a couple of transform changes to the data as there was 1 entry the was in text format and another that was in a different date format to the rest (15/08/2017) as opposed to the MM/DD/YYYY that the other entries are using.
Expression used:
aggr(RangeSum(Above(Count(DISTINCT ID),0,RowNo())),Month)

- Mark as New
- Bookmark
- Subscribe
- Mute
- Subscribe to RSS Feed
- Permalink
- Report Inappropriate Content
Not working
- Mark as New
- Bookmark
- Subscribe
- Mute
- Subscribe to RSS Feed
- Permalink
- Report Inappropriate Content
What part isn't working? could you upload your app or take screen shot to show your workings
- « Previous Replies
-
- 1
- 2
- Next Replies »