Unlock a world of possibilities! Login now and discover the exclusive benefits awaiting you.
- Qlik Community
- :
- All Forums
- :
- QlikView App Dev
- :
- Summarizing Data for Charting Percentage
- Subscribe to RSS Feed
- Mark Topic as New
- Mark Topic as Read
- Float this Topic for Current User
- Bookmark
- Subscribe
- Mute
- Printer Friendly Page
- Mark as New
- Bookmark
- Subscribe
- Mute
- Subscribe to RSS Feed
- Permalink
- Report Inappropriate Content
Summarizing Data for Charting Percentage
Hello --
I have a need to generate a supplier performance dashboard in Qlik. We will measure our suppliers on 3 metrics
1) On-Time Delivery %
2) Full Delivery %
3) Complete Delivery & On-Time %
I am struggling with #2 and #3 in this list, due to the way the data is split up in the data source. I started going down the road of pre-aggregating my data in SQL queries before it gets to Qlik, but I believe there is a better way.
For #2 - I need to calculate full delivery percentage for supplier deliveries. The trouble is that sometime we receive 1 delivery split up in 2 or 3 lines of data. The raw data looks like this:
| PO # | PO Line | PO Line Release # | Promise Date | Received Date | PO Receipt ID | Release Qty | Received Qty |
|---|---|---|---|---|---|---|---|
| 123 | 1 | 1 | 6/10/2014 | 6/8/2014 | 1234 | 50 | 25 |
| 123 | 1 | 1 | 6/10/2014 | 6/8/2014 | 1235 | 50 | 25 |
| 123 | 1 | 2 | 7/1/2014 | 7/1/2014 | 1236 | 150 | 50 |
| 123 | 1 | 2 | 7/1/2014 | 7/1/2014 | 1237 | 150 | 100 |
For this PO Release, all the delivered listed should be considered 100% fully delivered because even though we split the receipts 100% of the PO release qty was received on the same day.
The chart should look as follows in this case:
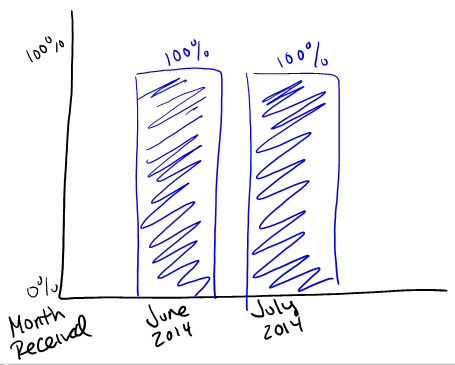
For #3, I will have the same set of data - but this time I need to also check if the total qty was received in full no earlier than 7 days BEFORE the promise date, and 1 day AFTER the promise date. I will then calculate the % of total of these that match the criteria.
I am struggling with how to do this without adding a lot more dimensions than I want to my chart. Can someone help me please?