Unlock a world of possibilities! Login now and discover the exclusive benefits awaiting you.
- Qlik Community
- :
- All Forums
- :
- QlikView App Dev
- :
- Re: Suppressing bar with no value on bar chart
- Subscribe to RSS Feed
- Mark Topic as New
- Mark Topic as Read
- Float this Topic for Current User
- Bookmark
- Subscribe
- Mute
- Printer Friendly Page
- Mark as New
- Bookmark
- Subscribe
- Mute
- Subscribe to RSS Feed
- Permalink
- Report Inappropriate Content
Suppressing bar with no value on bar chart
Some Background:
I have a graph which displays stacked bars in it based on two expressions
- Sum of Sales Amount for current year( Sorting of companies in bar graph happen by this expression)
- The actual bars for each company which come from expression 1 are showing the year over year % change in sales of two products A, B for each company(All the companies sell only two products A and B)
So from above two points the dimension of my bar graph is
- Company
- Product
The actual expression which I have are
Expression 1 (corresponding to point 1)
sum(<Category = {'TPC'}>Sales)
Expression 2(Corresponding to point 2)
(sum(<Category = {'TPC'}>Sales) - sum(<Category = {'TPC'} Year = {'$(vPreviousYear)'}>Sales)) /
sum(<Category = {'TPC'} Year = {'$(vPreviousYear)'}>Sales)
The Problem:
Now for chart the expression 1 is the hierarchically before than expression 2(In Properties -> Expressions section).
So I get all the companies (sorted on the basis of sum of sales ) for the selected year.But when the expression 2 gets evalueted(which calculates Year over Year change) there is no bar appearing for some companies.
The reason being those companies were not there in previous year due to which the denominator of Expression 2
sum(<Category = {'TPC'} Year = {'$(vPreviousYear)'}>Sales)
evaluates to 0.This produces a - (I think Null value indication by Qlikview) when I see the expression for a particular company which was not in previous year
So finally in graph for such companies I dont not get any bar but do get its name appeared.
My aim is that I dont want such companies to appear on graph( the companies for which Expression 2 would evaluate to null)
Also another case is where company may be there in selected year and previous year but one of the product would not be sold in previous year.
For example Company XYZ may have sold product A and B both in 2018 but just B in 2017.
So when Expression 2 is evaluated for product A it will give the same error as mentioned above
Some one please help me with this.I have spent an ample amount of time going over community and tried all possible solutions but still not getting over this
.
- « Previous Replies
-
- 1
- 2
- Next Replies »
Accepted Solutions
- Mark as New
- Bookmark
- Subscribe
- Mute
- Subscribe to RSS Feed
- Permalink
- Report Inappropriate Content
The bar for the PQR is not appearing because of the 'division by 0' error for product B and the other row for the same company for product A is being excluded as we have a condition to do calculation when there is value for current year. I hope this makes sense.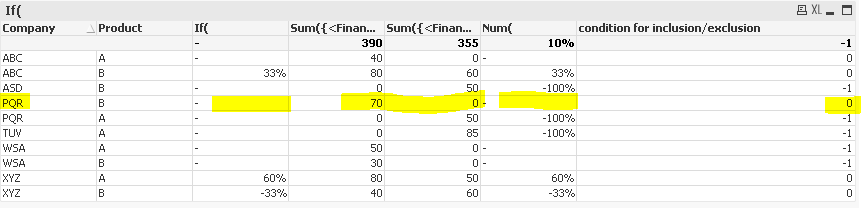
- Mark as New
- Bookmark
- Subscribe
- Mute
- Subscribe to RSS Feed
- Permalink
- Report Inappropriate Content
Nikhil,
please attach a .qvw so we can help you better.
Anyway, in the meantime, please note that the correct way to use a variable to evaluate on a Section Access is with double quotes, so the correct sintax is
sum(<Category = {'TPC'} Year = {"=$(vPreviousYear)"}>Sales)
instead of
sum(<Category = {'TPC'} Year = {'$(vPreviousYear)'}>Sales)
Simone
- Mark as New
- Bookmark
- Subscribe
- Mute
- Subscribe to RSS Feed
- Permalink
- Report Inappropriate Content
Thanks Simone,
Point taken about variable syntax.
The system on which I am working on which I am working for that upload is disable due to which I cannot upload the .qvw file
If you require any other clarification then please ask.I will answer each and every one
- Mark as New
- Bookmark
- Subscribe
- Mute
- Subscribe to RSS Feed
- Permalink
- Report Inappropriate Content
Click that after Reply and use Attach from Right corner if bottom to attach files
- Mark as New
- Bookmark
- Subscribe
- Mute
- Subscribe to RSS Feed
- Permalink
- Report Inappropriate Content
Hi simone.spanioloveisfail Please find the qvw file attached as requested.
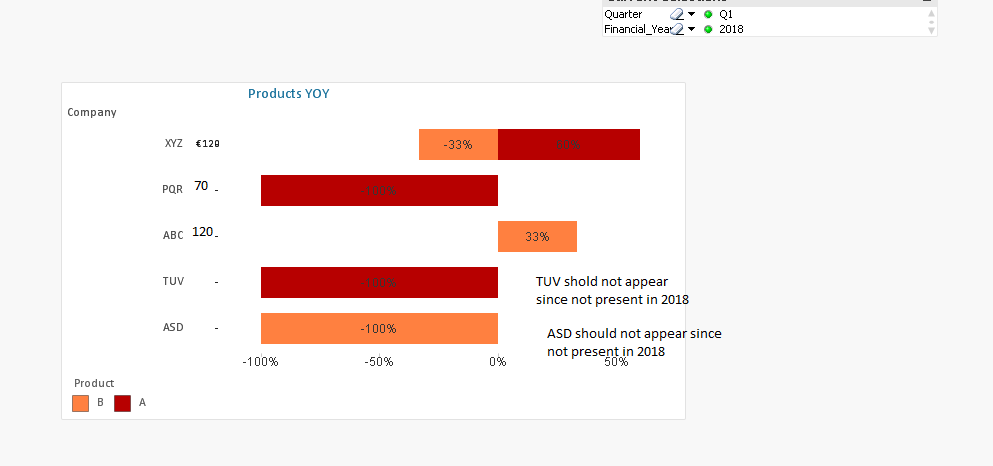
In the graph you can see that XYZ has "text on axis" values as 120 which is sum of sales of product A and product B for 2018 Q1
The graph shows the year of year change for product A and B in sales amount(Sales gone down by 33% for product B in 2018 Q1 as compared to that of 2017 Q1 and gone up for Product A by 60%)
Everything is fine when I have both products(A, B) for a company in 2017 Q1 and 2018 Q1 but when one of the product is missing in any of the year then I get a null value for Sales total(Null value for Text on axis)
For example:
- For Company PQR I have product A in 2017 Q1 but it is not in 2018 Q1.So I get a bar saying -100% decrease in sales for 2018 Q1 which is correct.But instead of -(Qlikveiw null) on text on axis I want Sales amount of 2018 Q1 there which is 70.(I know that is not for product A but for product B).If that is not possible then I would prefer that company PQR should not appear at all on the graph.
- Similary for company ABC.It has Product A and B both in 2018 Q1 but just Product B in 2017 Q1 the bar in graph says increase of 33% sales for 2018 Q1 which is correct but I do get a Null on text on axis.I either want total sales amount of 2018 Q1 as text on axis which is 120 or else ABC should not appear at all
In a nutshell what I feel is when in both year the values of dimensions (Product A and Product B) are same the result is expected but when there is mismatch(2017 Q1 has Product A and 2018 Q1 has Product B) then I get weird results.
P.S: I have changed the expression 1 from:
sum(<Category = {'TCP'}>Sales)
to
if(sum({<Financial_Year = {'$(Previous_Year)'}, Quarter = {'$(Selected_Quarter)'}, Category = {"TCP"}>} Sales)>0,
Aggr(sum({$ <Category = {"TCP"} >} Sales),Company))
Just making sure that a particular company exists in both years.Due to which WSA do not appears in bar chart.
- Mark as New
- Bookmark
- Subscribe
- Mute
- Subscribe to RSS Feed
- Permalink
- Report Inappropriate Content
Check this out. let me know if it meets your requirement..
- Mark as New
- Bookmark
- Subscribe
- Mute
- Subscribe to RSS Feed
- Permalink
- Report Inappropriate Content
Hi
Can you please provide the modifications you made.I am not able to open the file since I am using a personal edition.
- Mark as New
- Bookmark
- Subscribe
- Mute
- Subscribe to RSS Feed
- Permalink
- Report Inappropriate Content
I checked it and still I am getting Null Values for some companies.
- Mark as New
- Bookmark
- Subscribe
- Mute
- Subscribe to RSS Feed
- Permalink
- Report Inappropriate Content
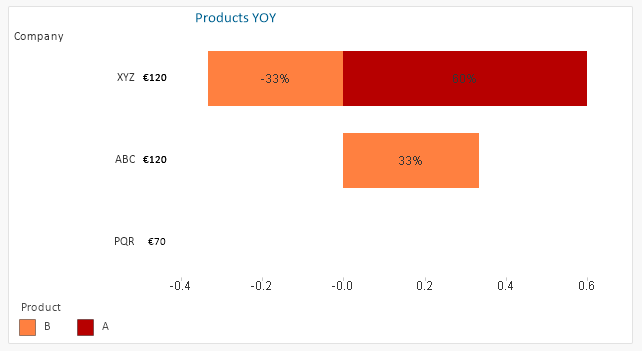
After I select 2018 Q1 my expected output is as follows
- Mark as New
- Bookmark
- Subscribe
- Mute
- Subscribe to RSS Feed
- Permalink
- Report Inappropriate Content
I was able to make the 'Values' field work with the below expression -
if(IsNull(Aggr(NODISTINCT Sum({<Company=P({<Financial_Year={'2018'}>}Company)> * <Company=P({<Financial_Year={'2017'}>}Company)>}Sales), Company)),Null(),Aggr(NODISTINCT Sum(Sales), Company))
BUT
the 'change' expression is not giving the bar value.
I am working on it but by the time I make it work, I thought I should share at least this part.
- « Previous Replies
-
- 1
- 2
- Next Replies »