Unlock a world of possibilities! Login now and discover the exclusive benefits awaiting you.
- Qlik Community
- :
- All Forums
- :
- QlikView App Dev
- :
- Supress specific line in chart
- Subscribe to RSS Feed
- Mark Topic as New
- Mark Topic as Read
- Float this Topic for Current User
- Bookmark
- Subscribe
- Mute
- Printer Friendly Page
- Mark as New
- Bookmark
- Subscribe
- Mute
- Subscribe to RSS Feed
- Permalink
- Report Inappropriate Content
Supress specific line in chart
Hi,
I have a line chart with four lines in it: Sales 2010, Sales 2011, Target 2011, Forecast 2011.
Is it possible to supress the Forecast line when a specific product is selected?
So, usually I would like all the lines but when making a selection on product I only would like to see the sales and target lines.
Kind regards,
Henco
Accepted Solutions
- Mark as New
- Bookmark
- Subscribe
- Mute
- Subscribe to RSS Feed
- Permalink
- Report Inappropriate Content
hencovanee - Yes, this is possible. I am assuming that you want to hide the trend line when you say "Surpress". Please correct me if this is not what you need.
Please select the expression (Forecast 2001) in your case. Then expand on the "+" plus sign and you can see Line Sytle option. You can select the Line Style option and then write the expression. In your case you can use the logic something like this...
IF(getselectedcount(Product) =0, [Your Preferred Color], RGB(255,255,255))
RGB(255,255,255) means white color. So when there is selection on the products the line color changes to white or else it shows your preferred color.
I am also attaching a screenshot for your reference
Hope this helps!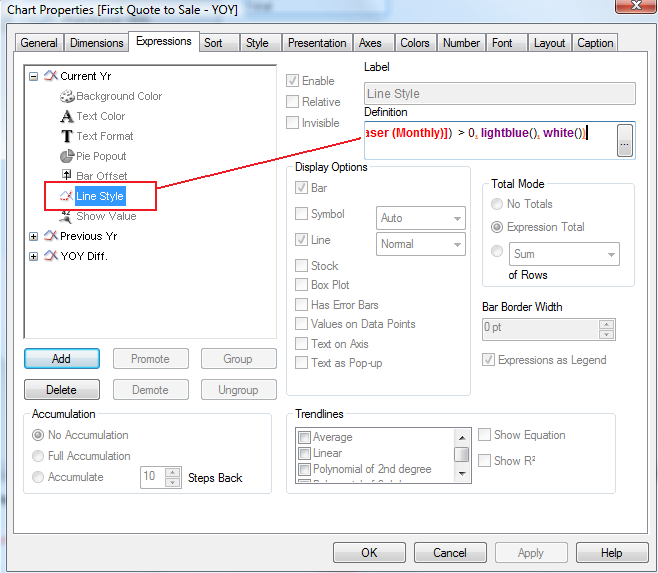
Cheers - DV
- Mark as New
- Bookmark
- Subscribe
- Mute
- Subscribe to RSS Feed
- Permalink
- Report Inappropriate Content
Ah, thank you very much DV. That will work.
Henco
- Mark as New
- Bookmark
- Subscribe
- Mute
- Subscribe to RSS Feed
- Permalink
- Report Inappropriate Content
Excellent! I am glad that it works. Please can you mark the post answered/helpful?
Cheers - DV