Unlock a world of possibilities! Login now and discover the exclusive benefits awaiting you.
- Qlik Community
- :
- All Forums
- :
- QlikView App Dev
- :
- Re: Table
- Subscribe to RSS Feed
- Mark Topic as New
- Mark Topic as Read
- Float this Topic for Current User
- Bookmark
- Subscribe
- Mute
- Printer Friendly Page
- Mark as New
- Bookmark
- Subscribe
- Mute
- Subscribe to RSS Feed
- Permalink
- Report Inappropriate Content
Table
Hi Friends,
I'd like to be able to display something like this
| MS1 | MS2 | MS3 | |
|---|---|---|---|
| Q1 | 1 | 0 | 1 |
| Q2 | 1 | 0 | 1 |
| Q3 | 1 | 1 | |
| Q4 | 1 | 1 | 1 |
SQL db table structure is like this
| Q1 | Q2 | Q3 | Q4 | MS | DELAER | COUNTRY |
|---|---|---|---|---|---|---|
| 1 | 1 | 1 | 1 | MS1 | ||
| 0 | 0 | 1 | MS2 | |||
| 1 | 1 | 1 | 1 | MS3 |
How can i do this.
I am using the personal edition and this is first report in Qlikview.
Appreciate if some one could help me in this.
Many Thanks,
Selva
- « Previous Replies
-
- 1
- 2
- Next Replies »
Accepted Solutions
- Mark as New
- Bookmark
- Subscribe
- Mute
- Subscribe to RSS Feed
- Permalink
- Report Inappropriate Content
You can use the Crosstable function to remodel the data:
MyTable:
Crosstable(Quarter, Value,3)
SQL Select MS, DELAER, COUNTRY, Q1, Q2, Q3, Q4
From ...mydatabasetablehere...;
Next you can use a pivot table chart object to show the data the way you want. Use Quarter and MS as dimensions and sum(Value) as expression. Expand the Quarter dimension so that the MS dimension becomes visible. Then drag the header of the MS dimension to the right and above the expression header. When you see a horizontal blue line you can let go and the MS dimension should be displayed horizontally.
talk is cheap, supply exceeds demand
- Mark as New
- Bookmark
- Subscribe
- Mute
- Subscribe to RSS Feed
- Permalink
- Report Inappropriate Content
very helpful thanks a lot Gysbert Wassenaar.
- Mark as New
- Bookmark
- Subscribe
- Mute
- Subscribe to RSS Feed
- Permalink
- Report Inappropriate Content
Hi,
How can i find the percentage for each question
| MS1 | MS2 | MS3 | % | |
|---|---|---|---|---|
| Q1 | 1 | 0 | 1 | sum(1+0+1)/count(ms) |
| Q2 | 1 | 0 | 1 | |
| Q3 | 1 | 1 | ||
| Q4 | 1 | 1 | 1 |
Appreciate if you could help me in this.
Thanks,
Selva
- Mark as New
- Bookmark
- Subscribe
- Mute
- Subscribe to RSS Feed
- Permalink
- Report Inappropriate Content
Try sum(Value)/count(total <MS> Value)
talk is cheap, supply exceeds demand
- Mark as New
- Bookmark
- Subscribe
- Mute
- Subscribe to RSS Feed
- Permalink
- Report Inappropriate Content
Hi,
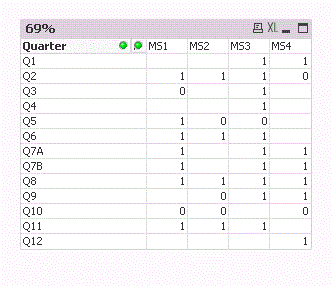
I am getting the table as below

I am trying to get the table like this
| MS1 | MS2 | MS3 | % | |
|---|---|---|---|---|
| Q1 | 1 | 0 | 1 | sum(1+0+1)/count(ms) |
| Q2 | 1 | 0 | 1 | |
| Q3 | 1 | 1 | ||
| Q4 | 1 | 1 | 1 |
Thanks,
Selva
- Mark as New
- Bookmark
- Subscribe
- Mute
- Subscribe to RSS Feed
- Permalink
- Report Inappropriate Content
See attached qvw.
talk is cheap, supply exceeds demand
- Mark as New
- Bookmark
- Subscribe
- Mute
- Subscribe to RSS Feed
- Permalink
- Report Inappropriate Content
Thanks a lot gwassenaar
- Mark as New
- Bookmark
- Subscribe
- Mute
- Subscribe to RSS Feed
- Permalink
- Report Inappropriate Content
Hi Gysbert,
I tried the expression as you mentioned. i am getting below.

i need the percentage value across each row. (Percentage value should display as column in the table)
Appreciate if you could help me in this.
Thanks,
Selva
- Mark as New
- Bookmark
- Subscribe
- Mute
- Subscribe to RSS Feed
- Permalink
- Report Inappropriate Content
Make sure you enabled the option Partial Sums for the MS dimension on the Presentation tab.
talk is cheap, supply exceeds demand
- « Previous Replies
-
- 1
- 2
- Next Replies »