Unlock a world of possibilities! Login now and discover the exclusive benefits awaiting you.
- Qlik Community
- :
- All Forums
- :
- QlikView App Dev
- :
- Take only the last hours last reload
- Subscribe to RSS Feed
- Mark Topic as New
- Mark Topic as Read
- Float this Topic for Current User
- Bookmark
- Subscribe
- Mute
- Printer Friendly Page
- Mark as New
- Bookmark
- Subscribe
- Mute
- Subscribe to RSS Feed
- Permalink
- Report Inappropriate Content
Take only the last hours last reload
Hello,
I have a chart that show me the data of the all 2015. there are already a calendar and all data is possible to have for a fixed instant.
Now I would like to show in the chart just the data inherent of the last hour from the last reload.
Someone can help me?
Regards and Happy new Year
- Mark as New
- Bookmark
- Subscribe
- Mute
- Subscribe to RSS Feed
- Permalink
- Report Inappropriate Content
Hi Pasquale,
I am not completely clear about your requirement, so try something like this :
create a field in backend which capture the reload time:
Load
reloadtime() as Timefield,
from <>;
In expression:
Sum(<Yourdatefield={'Timefield+1'}>}Sales)
You can give a try or please explain a bit more about your requirement.
Regards
KC
KC
- Mark as New
- Bookmark
- Subscribe
- Mute
- Subscribe to RSS Feed
- Permalink
- Report Inappropriate Content
Hi,
One approach could be to capture the reload time with ReloadTime() function:
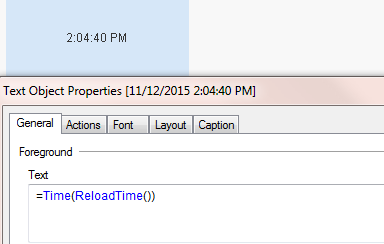
And then assign this to a variable and use it in your set analysis.
- Mark as New
- Bookmark
- Subscribe
- Mute
- Subscribe to RSS Feed
- Permalink
- Report Inappropriate Content
Hi,
Check this,
In Backend:
Data:
LOAD *,
Reloadtime() as  ReloadTime
 INLINE [
    Customer, DataTime,Sales
    1, 04/01/2016 6:03:02 PM,33
    2, 04/01/2016 6:03:02 PM,99
    3, 04/01/2016 6:03:02 PM,88
    4, 04/01/2016 6:03:02 PM,88
    5, 03/01/2016 8:03:02 PM,88
    6, 03/01/2016 9:03:02 PM,88
];
Front end:
Chart expression:- If(Hour(DataTime)=Hour(ReloadTime),Sum(Sales))
PFA,
HTH,
-Hirish
- Mark as New
- Bookmark
- Subscribe
- Mute
- Subscribe to RSS Feed
- Permalink
- Report Inappropriate Content
hello Sinan,
thanks for reply.
How I can take the date from the 1 hour before?
For example your picture shows 2:04, in this case I need to take the data from 1:04 to 2:04.
Later I will use this in my set analysis
Regards
- Mark as New
- Bookmark
- Subscribe
- Mute
- Subscribe to RSS Feed
- Permalink
- Report Inappropriate Content
First you need a field in the data which stores the date and time data for my example I will call this field Date (p.s it must be formatted as a timestamp in script)
Then simply use this function in your expression replacing the field I have called 'data' with the field in your dataset you want to sum.
=sum({< Date = {">$(= timestamp(ReloadTime()- 0.04167))"}>} data)
p.s in a timestamp 0.04167 is 1 hr...so reloadtime - 0.04167 will be an hour before it.
- Mark as New
- Bookmark
- Subscribe
- Mute
- Subscribe to RSS Feed
- Permalink
- Report Inappropriate Content
Something like the below:
Count({<SessionLogTime = {">=$(=Time($(vReloadtime) - Time('01:00', 'hh:mm')))"}>}Distinct SessionID)