Unlock a world of possibilities! Login now and discover the exclusive benefits awaiting you.
- Qlik Community
- :
- All Forums
- :
- QlikView App Dev
- :
- QV Script arithmetic problem
- Subscribe to RSS Feed
- Mark Topic as New
- Mark Topic as Read
- Float this Topic for Current User
- Bookmark
- Subscribe
- Mute
- Printer Friendly Page
- Mark as New
- Bookmark
- Subscribe
- Mute
- Subscribe to RSS Feed
- Permalink
- Report Inappropriate Content
QV Script arithmetic problem
Greetings,
imagine the following table
Date | Quantity | QtdStock
15/02/2015 | 180 | 200
18/02/2015 | 80 | 200
1/02/2015 | 150 | 200
16/02/2015 | 100 | 200
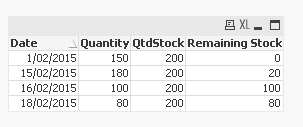
I need to create a field that has the values of the remaining quantities in stock knowing that the products are removed from stock by date so the final table should be something like this:
Date | Quantity | StockTotal | Remaining Stock
15/02/2015 | 180 | 200 | 20
18/02/2015 | 80 | 200 | 80
1/02/2015 | 150 | 200 | 0
16/02/2015 | 100 | 200 | 100
Hope you can help me and thank you in advance.
- Tags:
- arithmetic
- scripiting
- « Previous Replies
-
- 1
- 2
- Next Replies »
Accepted Solutions
- Mark as New
- Bookmark
- Subscribe
- Mute
- Subscribe to RSS Feed
- Permalink
- Report Inappropriate Content
May be this:
Table:
LOAD * Inline [
Date | Quantity | QtdStock
15/02/2015 | 180 | 200
18/02/2015 | 80 | 200
1/02/2015 | 150 | 200
16/02/2015 | 100 | 200
] (delimiter is |);
FinalTable:
LOAD *,
If(QtdStock >= CumQuantity, Quantity,
If(Temp >=0, QtdStock - Quantity, 0)) as [Remaining Stock];
LOAD *,
RangeSum(Peek('QtdStock'), -Peek('CumQuantity')) as Temp;
LOAD *,
RangeSum(Peek('CumQuantity'), Quantity) as CumQuantity
Resident Table
Order By Date desc;
DROP Table Table;
- Mark as New
- Bookmark
- Subscribe
- Mute
- Subscribe to RSS Feed
- Permalink
- Report Inappropriate Content
Don't really understand how you are arriving at Remaining Stock Values? Can you explain the calculations?
- Mark as New
- Bookmark
- Subscribe
- Mute
- Subscribe to RSS Feed
- Permalink
- Report Inappropriate Content
I don't know how to calculate in script but the concept is from the most recent date to the oldest you have to see how much stock is left knowing that this is a FIFO system. The recent data is 18/02 so all the 80 are still on the Stock, next is 16/02 and this is also all in the stock. Next we are at 15/02 and from the 200 that we know that is the total of the stock we only have 200-80-100 = 20. So from the 180 bought on 15/02 we only have 20 left on the stock.
- Mark as New
- Bookmark
- Subscribe
- Mute
- Subscribe to RSS Feed
- Permalink
- Report Inappropriate Content
Hi Simão Ribeiro,
Your imagine table is not showing the data properly .
and also the date column is not in proper sorting .
can you upload the real time dummy data to arraive Remaining Stock ?
Thanks
- Mark as New
- Bookmark
- Subscribe
- Mute
- Subscribe to RSS Feed
- Permalink
- Report Inappropriate Content
Sorry I don't seem to understand these calculations can you do them per row so we can see how you get to the amount remaining.
- Mark as New
- Bookmark
- Subscribe
- Mute
- Subscribe to RSS Feed
- Permalink
- Report Inappropriate Content
I am not sure I understand the calculation - I would thionk you would start at the oldest date and work toward the most recent - here is what we started with, the activity that took place and here is what we are left with?
- Mark as New
- Bookmark
- Subscribe
- Mute
- Subscribe to RSS Feed
- Permalink
- Report Inappropriate Content
Maybe this is helpful: Is it possible FIFO in QlikView and there are further postings available: https://community.qlik.com/search.jspa?q=fifo.
- Marcus
- Mark as New
- Bookmark
- Subscribe
- Mute
- Subscribe to RSS Feed
- Permalink
- Report Inappropriate Content
1/02/2015 is the earlierst date? How do you get 0? You have 200 in stock and sold 150?
- Mark as New
- Bookmark
- Subscribe
- Mute
- Subscribe to RSS Feed
- Permalink
- Report Inappropriate Content
So... From the beginning...
Date | Quantity | Remaining Stock | Price per unit
15/02/2015 | 180 | 20 | 1,36
18/02/2015 | 80 | 80 | 1,4
1/02/2015 | 150 | 0 | 1,6
16/02/2015 | 100 | 100 | 1,4
The true table is only this but i know that i have 200 in my stock but i want to separate this in parts because in each date i have different values per unit.
I have to separate this 200 in parts and i also know that the first items to enter the warehouse are the first ones to leave, so the 200 items that are still in the warehouse are the last items to enter.
Maybe the name doesn't fit so well but try to abstract the names and think only in quantities of the same product with different prices
- Mark as New
- Bookmark
- Subscribe
- Mute
- Subscribe to RSS Feed
- Permalink
- Report Inappropriate Content
No, that is the oldest date. I get 0 because all the 150 got sold and there are 200 in stock distributed by the most recent entries in the stock
- « Previous Replies
-
- 1
- 2
- Next Replies »