Unlock a world of possibilities! Login now and discover the exclusive benefits awaiting you.
- Qlik Community
- :
- All Forums
- :
- QlikView App Dev
- :
- Team average and std deviation
- Subscribe to RSS Feed
- Mark Topic as New
- Mark Topic as Read
- Float this Topic for Current User
- Bookmark
- Subscribe
- Mute
- Printer Friendly Page
- Mark as New
- Bookmark
- Subscribe
- Mute
- Subscribe to RSS Feed
- Permalink
- Report Inappropriate Content
Team average and std deviation
Hi all,
I want to build a table that shows me the following:
Team total case volume
Average case volume per team member
+/- 1 and 2 std deviations of the case volume
| Team | Total Case Volume | No. Team Members | Avg Case Volume/Member | 1 Std Deviation | 2 Std Deviations |
|---|---|---|---|---|---|
The objective is to identify team member performance in relation to the whole.
Any assistance on getting this going would be appreciated!
Accepted Solutions
- Mark as New
- Bookmark
- Subscribe
- Mute
- Subscribe to RSS Feed
- Permalink
- Report Inappropriate Content
- Mark as New
- Bookmark
- Subscribe
- Mute
- Subscribe to RSS Feed
- Permalink
- Report Inappropriate Content
Hi John,
This are some clues:
- 'Team' field as a dimension.
- An expression with something like "Sum(Volume)" or "Count(Volume)" for 'Total Case Volume'
- An expression with something like "Count(DISTINCT Employee)" for 'No. Team Members'
- An expression with something like "[Total Case Volume] / [No. Team Members]" for 'Avg Case Volume / Members'
- An expression with something like "Std(Volume)" for '1 Std Deviation'
Regards,
H
- Mark as New
- Bookmark
- Subscribe
- Mute
- Subscribe to RSS Feed
- Permalink
- Report Inappropriate Content
Would you be able to share some sample data and the output you expect to see from the sample data?
- Mark as New
- Bookmark
- Subscribe
- Mute
- Subscribe to RSS Feed
- Permalink
- Report Inappropriate Content
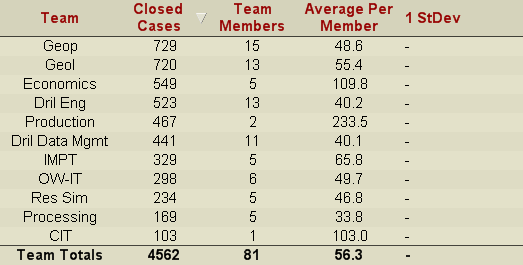
Here are the results after applying Hector's clues. The Stdev function not working yet: Stdev([Closed Cases])
- Mark as New
- Bookmark
- Subscribe
- Mute
- Subscribe to RSS Feed
- Permalink
- Report Inappropriate Content
May be like this
Stdev(Aggr(Count(Volume), Employee, Team))
- Mark as New
- Bookmark
- Subscribe
- Mute
- Subscribe to RSS Feed
- Permalink
- Report Inappropriate Content
Excellent! thanks to the both of you for the help!