Unlock a world of possibilities! Login now and discover the exclusive benefits awaiting you.
- Qlik Community
- :
- All Forums
- :
- QlikView App Dev
- :
- Re: Test
- Subscribe to RSS Feed
- Mark Topic as New
- Mark Topic as Read
- Float this Topic for Current User
- Bookmark
- Subscribe
- Mute
- Printer Friendly Page
- Mark as New
- Bookmark
- Subscribe
- Mute
- Subscribe to RSS Feed
- Permalink
- Report Inappropriate Content
Test
Hi All,
Please find the attachment of the QVW file ..
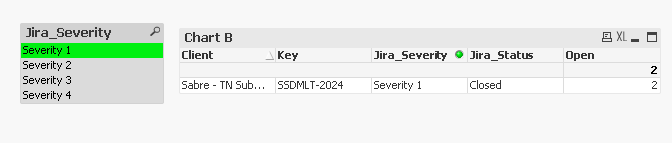
Two table charts .
Chart A and Chart B ..
The chart B gives me the information about the detail ..
For Example i f i Clcik on any of the severity say Sevrity 1, 2 or 3 then the chart B should display information only to that number of Key's ...
For example i have clicked on Severity 1 Open which is 2 ..then the detailed Table show display only two releated records ..
How can i ahcive this ?
Please suggest
Thanks in Advance
- Mark as New
- Bookmark
- Subscribe
- Mute
- Subscribe to RSS Feed
- Permalink
- Report Inappropriate Content
Are you looking this?
- Mark as New
- Bookmark
- Subscribe
- Mute
- Subscribe to RSS Feed
- Permalink
- Report Inappropriate Content
HI Anil,
In "chart A " i will be clicking any of the OPEN or CLOSED row for perticular month. and perticular Severity..
Then the Chart B should give me the information related to that cell.
For example if i select Seveirty 1 , OPEN ..which has 2 counts ..
then the Chart 2 has to display only 2 records...( that is what is the key , project name severity , status 2 rows should appear there)
i will not be using any filters..
I hope i made nearing to make you undesdratnd,..
Thanks