Unlock a world of possibilities! Login now and discover the exclusive benefits awaiting you.
- Qlik Community
- :
- All Forums
- :
- QlikView App Dev
- :
- Re: Text On Axis overlapping - can it go diagonal?
- Subscribe to RSS Feed
- Mark Topic as New
- Mark Topic as Read
- Float this Topic for Current User
- Bookmark
- Subscribe
- Mute
- Printer Friendly Page
- Mark as New
- Bookmark
- Subscribe
- Mute
- Subscribe to RSS Feed
- Permalink
- Report Inappropriate Content
Text On Axis overlapping - can it go diagonal?
I am attempting to create a bar chart where my x-axis is a list of initiatives, and my y-axis measures costs of those initiatives. I would like to mark an an initiative's text in red if its forecasted costs are higher than its planned costs in order to call attention to it.
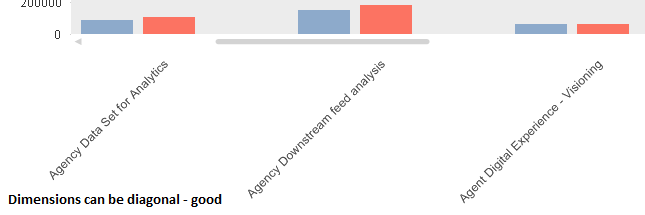
I cannot do this with my dimensions, because any conditional formatting will apply across ALL initiatives, as the dimensions do not measure by each independent value but rather in aggregate. Due to the character length of the initiatives, I can only see the full name of the initative by utilizing the Chart Properties>Axes>Dimension Axis diagonal feature. This is important later.
I unchecked "Show Legend" in my dimension. I created a new expression =only([Initiative Name]) which displays the initiative in the x-axis, similar as if the dimension "Show Legend" was checked. However, my Text on Axis is overlapping. I would like to make it vertical or diagonal, similar to the option as if I had my dimension labels showing. I've been doing a lot of searching but cannot seem to find a solution.
Does anyone know how to make the Text on Axis sitting on the x-axis vertical or diagonal?


- Mark as New
- Bookmark
- Subscribe
- Mute
- Subscribe to RSS Feed
- Permalink
- Report Inappropriate Content
Don't use Text on Axis
Add an Expression as Follows
=DUAL( 'YourText you want to show' ,1) and now use values on data points
If a post helps to resolve your issue, please accept it as a Solution.
- Mark as New
- Bookmark
- Subscribe
- Mute
- Subscribe to RSS Feed
- Permalink
- Report Inappropriate Content
can you post some sample data?
If a post helps to resolve your issue, please accept it as a Solution.