Unlock a world of possibilities! Login now and discover the exclusive benefits awaiting you.
- Qlik Community
- :
- All Forums
- :
- QlikView App Dev
- :
- The best way to compare many dimensions?
- Subscribe to RSS Feed
- Mark Topic as New
- Mark Topic as Read
- Float this Topic for Current User
- Bookmark
- Subscribe
- Mute
- Printer Friendly Page
- Mark as New
- Bookmark
- Subscribe
- Mute
- Subscribe to RSS Feed
- Permalink
- Report Inappropriate Content
The best way to compare many dimensions?
Hi, I would appreciate any example or idea covering one discovery situation we would like to use QV for.
It is about comparing two sets of dimensions (item attributes) and mark differences between, for example, Field1 vs. Field101, Field2 vs. Field102, Field3 vs. Field103, . . . Field20 vs. Field120. One table has already been created. You got a picture. I hop so.
thx a lot
Accepted Solutions
- Mark as New
- Bookmark
- Subscribe
- Mute
- Subscribe to RSS Feed
- Permalink
- Report Inappropriate Content
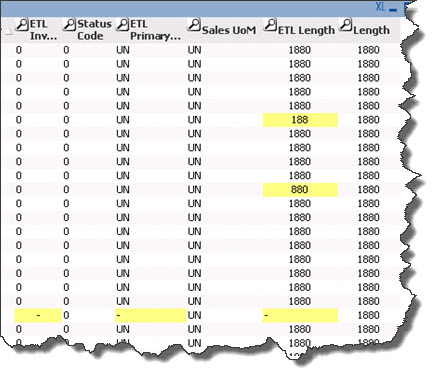
In the meantime I came to this solution which in combinaction with Excel (sorting by color, etc.) is a great help for users.
- Mark as New
- Bookmark
- Subscribe
- Mute
- Subscribe to RSS Feed
- Permalink
- Report Inappropriate Content
I believe you have to use joins for comparing the data and that depends on the situation and the logic from which fields you have to check the data.
- Mark as New
- Bookmark
- Subscribe
- Mute
- Subscribe to RSS Feed
- Permalink
- Report Inappropriate Content
The table is not a problem as I wrote. Sorry for the confusion. Imagine these structure:
rowid, sku, f1, f101, f2, f102, f3, f103 and these rows:
#1, sku1, desc-1, desc-1, kg, t, fg, fg
#2, sku2, abcdef, acdef, kg, kg, fg, fg
So, in row 1 there's is a difference between values in f2 and f102. And in row 2 there is a difference between values in f1 and f101
I know I can show these in the straight table but have 60 (30*2) fields to show.
- Mark as New
- Bookmark
- Subscribe
- Mute
- Subscribe to RSS Feed
- Permalink
- Report Inappropriate Content
In the meantime I came to this solution which in combinaction with Excel (sorting by color, etc.) is a great help for users.