Unlock a world of possibilities! Login now and discover the exclusive benefits awaiting you.
Announcements
April 13–15 - Dare to Unleash a New Professional You at Qlik Connect 2026: Register Now!
- Qlik Community
- :
- All Forums
- :
- QlikView App Dev
- :
- Time Line Chart
Options
- Subscribe to RSS Feed
- Mark Topic as New
- Mark Topic as Read
- Float this Topic for Current User
- Bookmark
- Subscribe
- Mute
- Printer Friendly Page
Turn on suggestions
Auto-suggest helps you quickly narrow down your search results by suggesting possible matches as you type.
Showing results for
Not applicable
2012-05-11
02:51 AM
- Mark as New
- Bookmark
- Subscribe
- Mute
- Subscribe to RSS Feed
- Permalink
- Report Inappropriate Content
Time Line Chart
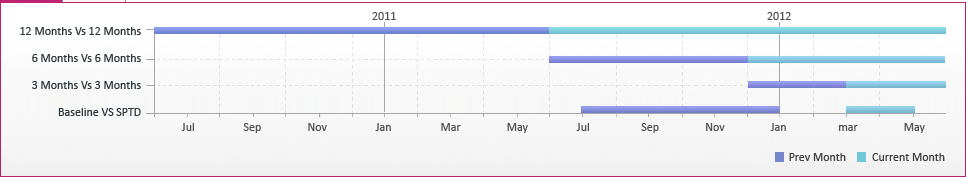
I have to make this chart with the following data available.
| Time Frame | Current Month Start Date | Current Month Last Date | Previous Month Start Date | Previous Month End Date |
| 3 Months Vs 3 Months | 12/1/2011 | 2/1/2012 | 9/1/2011 | 11/1/2011 |
| 6 Months Vs 6 Months | 9/1/2011 | 2/1/2012 | 3/1/2011 | 8/1/2011 |
| 12 Months Vs 12 Months | 3/1/2011 | 2/1/2012 | 3/1/2010 | 2/1/2011 |
| Baseline Vs SPTD | 1/1/2012 | 2/1/2012 | 4/1/2011 | 9/1/2011 |
How can i make this. I am really struggling to make this. Can anyone please attach a sample qvw file after making this. I will really be obliged.
Dates are in MM/DD/YYYY format
3,597 Views
1 Solution
Accepted Solutions
Former Employee
2012-05-11
03:32 AM
- Mark as New
- Bookmark
- Subscribe
- Mute
- Subscribe to RSS Feed
- Permalink
- Report Inappropriate Content
You can make a Gantt chart by using the expression attribute "Bar Offset".
HIC
4 Replies
Former Employee
2012-05-11
03:32 AM
- Mark as New
- Bookmark
- Subscribe
- Mute
- Subscribe to RSS Feed
- Permalink
- Report Inappropriate Content
You can make a Gantt chart by using the expression attribute "Bar Offset".
HIC
Not applicable
2012-05-11
07:07 AM
Author
- Mark as New
- Bookmark
- Subscribe
- Mute
- Subscribe to RSS Feed
- Permalink
- Report Inappropriate Content
Hi Henric,
Its working. But i want to get Month name instead of Dates. How may i do that ??
1,798 Views
Former Employee
2012-05-11
07:44 AM
- Mark as New
- Bookmark
- Subscribe
- Mute
- Subscribe to RSS Feed
- Permalink
- Report Inappropriate Content
In the properties of the chart, under "Number", I have set the format of the axis to M/D/YYYY.
Change this to 'MMM YYYY'.
HIC
Not applicable
2012-05-11
03:57 PM
Author
- Mark as New
- Bookmark
- Subscribe
- Mute
- Subscribe to RSS Feed
- Permalink
- Report Inappropriate Content
Thank you Henric. It works 
1,798 Views