Unlock a world of possibilities! Login now and discover the exclusive benefits awaiting you.
- Qlik Community
- :
- All Forums
- :
- QlikView App Dev
- :
- Re: Time stamp as Dimension......
- Subscribe to RSS Feed
- Mark Topic as New
- Mark Topic as Read
- Float this Topic for Current User
- Bookmark
- Subscribe
- Mute
- Printer Friendly Page
- Mark as New
- Bookmark
- Subscribe
- Mute
- Subscribe to RSS Feed
- Permalink
- Report Inappropriate Content
Time stamp as Dimension......
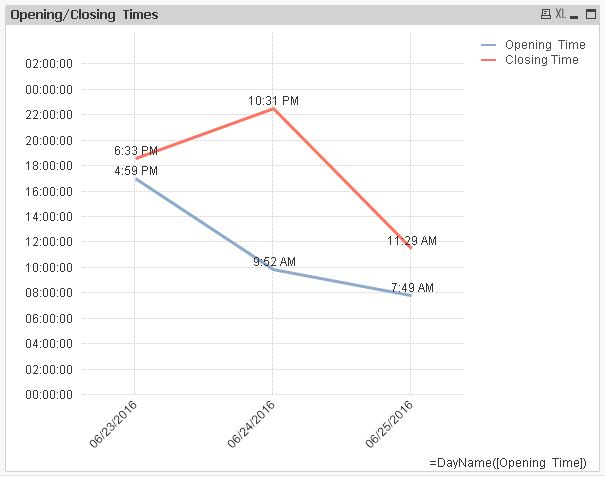
I have 02 time stamps e.g. Opening Time and Closing Time. in this format 6/23/2016 4:59:00 PM 6/23/2016 6:33:00 PM for the month of JUNE 2016.
Now I want to show in a line chart only Hour & Minutes as values on Data Points for each day separately. What will be the expression for it.
Second i want to show the difference of time between the 2 dates using the same dimension i.e. it should show Total hour and minutes worked each day .
Any suggestion please.
Accepted Solutions
- Mark as New
- Bookmark
- Subscribe
- Mute
- Subscribe to RSS Feed
- Permalink
- Report Inappropriate Content
Hi,
maybe something like this:
tabOpenCloseTime:
LOAD Timestamp#([Opening  Time],'MM/DD/YYYY  hh:mm:ss TT') as [Opening  Time],
    Timestamp#([Closing Time],'MM/DD/YYYY  hh:mm:ss TT') as [Closing Time]
Inline [
Opening  Time,Closing Time
6/23/2016  4:59:00 PM,6/23/2016  6:33:00 PM
6/24/2016  9:52:00 AM,6/24/2016  10:31:00 PM
6/25/2016  7:49:00 AM,6/25/2016  11:29:00 AM
];
hope this hlps
regards
Marco
- Mark as New
- Bookmark
- Subscribe
- Mute
- Subscribe to RSS Feed
- Permalink
- Report Inappropriate Content
=Interval(TimeStamp(TimeStamp#('6/23/2016 6:33:00 PM','M/DD/YYYY h:mm:ss TT'))
-TimeStamp(TimeStamp#('6/23/2016 4:59:00 PM','M/DD/YYYY h:mm:ss TT')))
- Mark as New
- Bookmark
- Subscribe
- Mute
- Subscribe to RSS Feed
- Permalink
- Report Inappropriate Content
Hi,
maybe something like this:
tabOpenCloseTime:
LOAD Timestamp#([Opening  Time],'MM/DD/YYYY  hh:mm:ss TT') as [Opening  Time],
    Timestamp#([Closing Time],'MM/DD/YYYY  hh:mm:ss TT') as [Closing Time]
Inline [
Opening  Time,Closing Time
6/23/2016  4:59:00 PM,6/23/2016  6:33:00 PM
6/24/2016  9:52:00 AM,6/24/2016  10:31:00 PM
6/25/2016  7:49:00 AM,6/25/2016  11:29:00 AM
];
hope this hlps
regards
Marco
- Mark as New
- Bookmark
- Subscribe
- Mute
- Subscribe to RSS Feed
- Permalink
- Report Inappropriate Content
Thanks
- Mark as New
- Bookmark
- Subscribe
- Mute
- Subscribe to RSS Feed
- Permalink
- Report Inappropriate Content
Thanks Marco !
exactly the same thing I needed. 
- Mark as New
- Bookmark
- Subscribe
- Mute
- Subscribe to RSS Feed
- Permalink
- Report Inappropriate Content
Its not working when I loaded data from Excel File,
Can you please tell me what changes I have to made when same data is loaded from Excel File.
Regards,