Unlock a world of possibilities! Login now and discover the exclusive benefits awaiting you.
- Qlik Community
- :
- All Forums
- :
- QlikView App Dev
- :
- Toggle between percentage and numbers on a chart
- Subscribe to RSS Feed
- Mark Topic as New
- Mark Topic as Read
- Float this Topic for Current User
- Bookmark
- Subscribe
- Mute
- Printer Friendly Page
- Mark as New
- Bookmark
- Subscribe
- Mute
- Subscribe to RSS Feed
- Permalink
- Report Inappropriate Content
Toggle between percentage and numbers on a chart
Hi All,
I have requirement to toggle between 2 sets of charts using the push of a button. One set of charts shows values as numbers. The other shows it as a percentage.
Currently I have created two sets of charts, one with the 'relative' option enabled, the other with the option disabled and I am doing a conditional hide/show based on the push of the button.
I have attached a sample file.
Could somebody suggest a way to accomplish this with a single chart?
Accepted Solutions
- Mark as New
- Bookmark
- Subscribe
- Mute
- Subscribe to RSS Feed
- Permalink
- Report Inappropriate Content
An option could be to use a container object to toggle the different chart objects. There is no built-in functionality to make the presentation toggling easier than that.
- Mark as New
- Bookmark
- Subscribe
- Mute
- Subscribe to RSS Feed
- Permalink
- Report Inappropriate Content
An option could be to use a container object to toggle the different chart objects. There is no built-in functionality to make the presentation toggling easier than that.
- Mark as New
- Bookmark
- Subscribe
- Mute
- Subscribe to RSS Feed
- Permalink
- Report Inappropriate Content
Please see attached solution. I noticed this issue on other QVWs, but for some reason the percentage view won't show the percentage sign on the axis (i.e. it will show .4 and not 40%). But hopefully this will at least give you an idea of how this problem can be solved.
Regards,
- Mark as New
- Bookmark
- Subscribe
- Mute
- Subscribe to RSS Feed
- Permalink
- Report Inappropriate Content
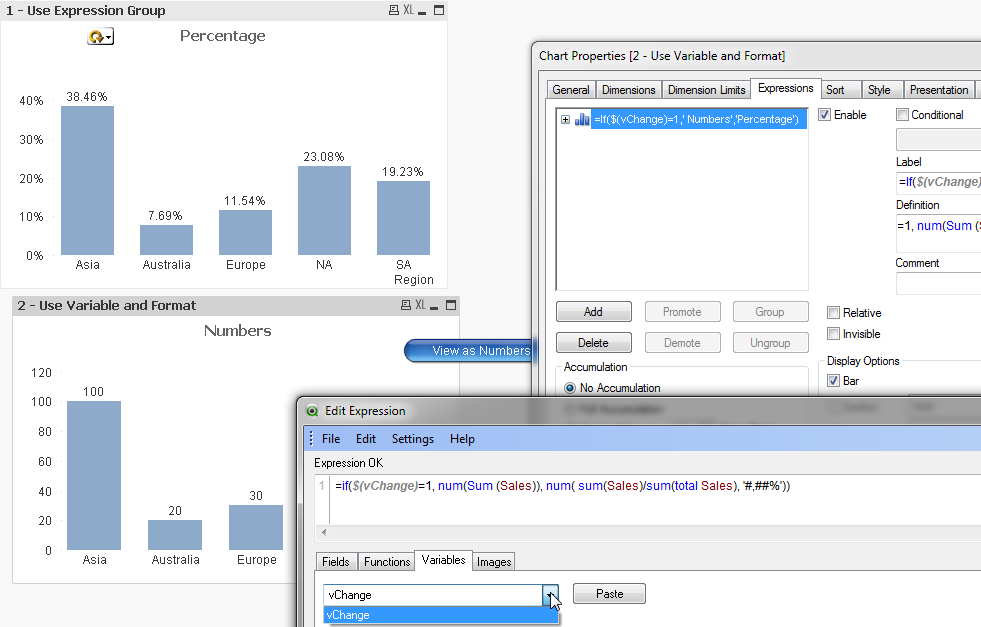
Hi, I created two solution on the attachment.
1 - Use grouped expression (use cycle icon)
2 - Use your variable and change the formula and number format.
Hope it helps,
- Mark as New
- Bookmark
- Subscribe
- Mute
- Subscribe to RSS Feed
- Permalink
- Report Inappropriate Content
Hi Tony, Vlad.
Thank you very much for your solutions.
Regards,
Neeraj
- Mark as New
- Bookmark
- Subscribe
- Mute
- Subscribe to RSS Feed
- Permalink
- Report Inappropriate Content
Thanks Erich !
- Mark as New
- Bookmark
- Subscribe
- Mute
- Subscribe to RSS Feed
- Permalink
- Report Inappropriate Content
Simple and effective...;-) Many thanks Erich
- Mark as New
- Bookmark
- Subscribe
- Mute
- Subscribe to RSS Feed
- Permalink
- Report Inappropriate Content
Hi,
I tried this example for my own application and while I can get the cycle charts to work fine the dilemma there is that it only works on a single chart and not multiple charts at the same time, so I was hoping I could adapt what I wanted to do from the 2nd option using the toggle button.
However, taking the exact same code from the Percentage - solution.qvw (122.5 K) I cannot get the buttons or plot to change from % to numbers.
If I run the Percentage - solution.qvw file from this forum directly it works fine.
It appears that my end the SET variables are not being saved or activated in some way. If I use a SET line in the script then the variables set like that are visible as a variable but not anything using the button action - new action -> External -> Set variable method.
Please can someone let me know what step I'm missing to get this to work.
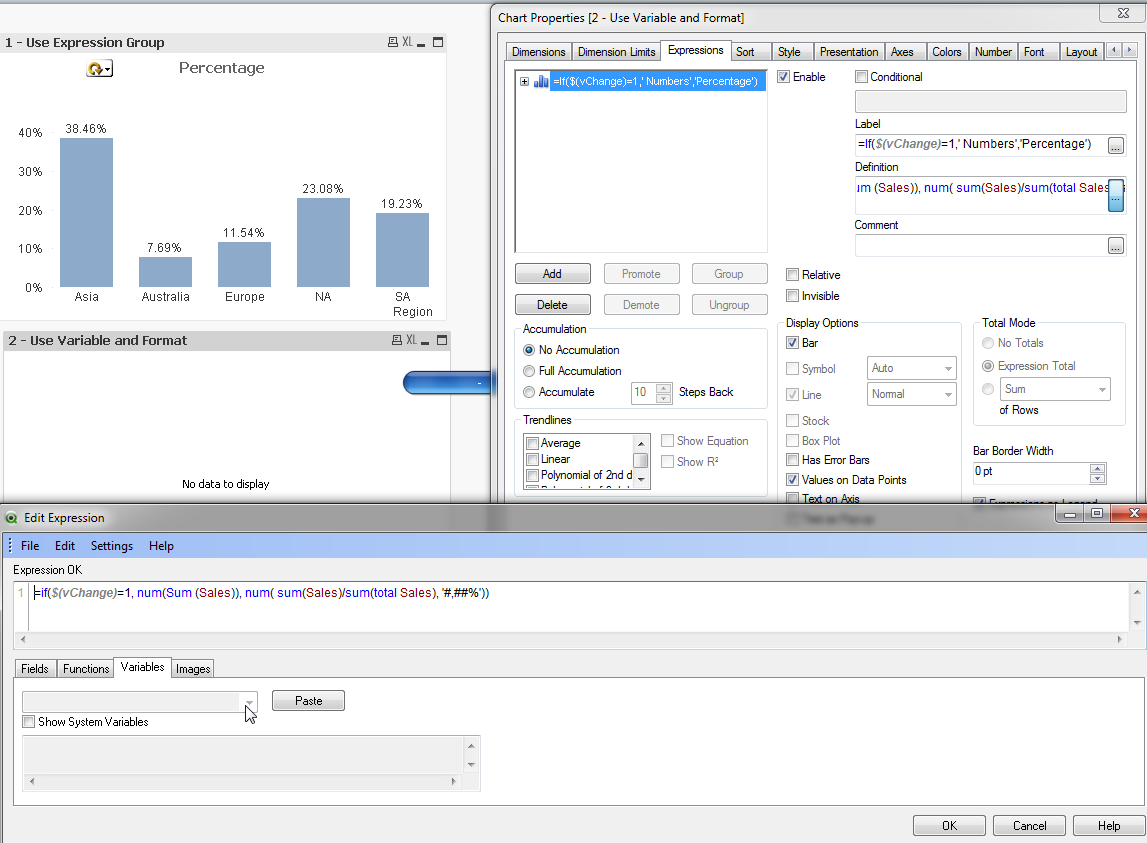
Original QVW which works and shows the variable

Copied QVW code to a blank new document which doesnt work and also shows no variable despite being defined.

Thanks![Button Properties [-]_2012-06-29_12-16-07.png](/legacyfs/online/17177_Button+Properties+%5B-%5D_2012-06-29_12-16-07.png)
- Mark as New
- Bookmark
- Subscribe
- Mute
- Subscribe to RSS Feed
- Permalink
- Report Inappropriate Content
OK figured it out. The missing link I wasnt aware of needing to do is this. In the QV menu one needs to also go to Settings -> Variable Overview and define the variable being used. ,i.e. do this, then it works.
