Unlock a world of possibilities! Login now and discover the exclusive benefits awaiting you.
Announcements
SYSTEM MAINTENANCE: Thurs., Sept. 19, 1 AM ET, Platform will be unavailable for approx. 60 minutes.
- Qlik Community
- :
- All Forums
- :
- QlikView App Dev
- :
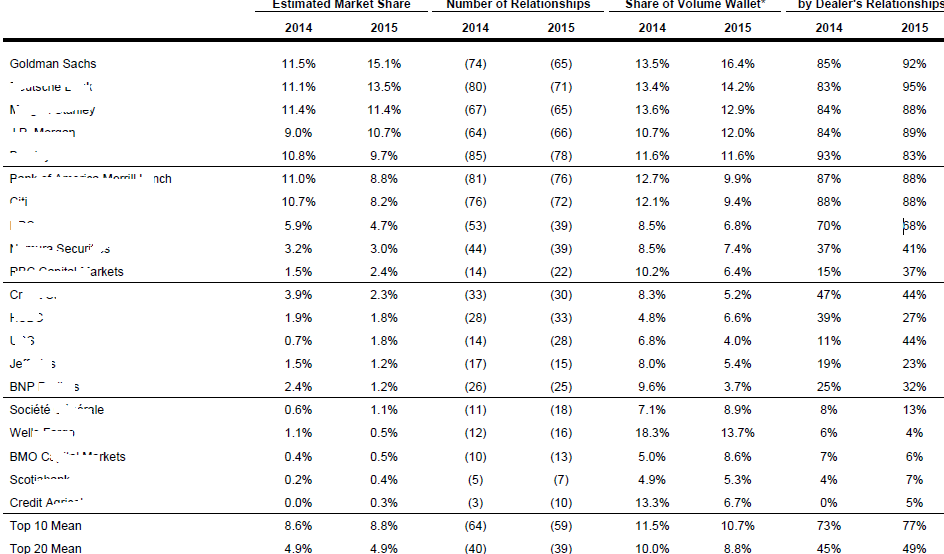
- Top 10 & Top 20 Mean
Options
- Subscribe to RSS Feed
- Mark Topic as New
- Mark Topic as Read
- Float this Topic for Current User
- Bookmark
- Subscribe
- Mute
- Printer Friendly Page
Turn on suggestions
Auto-suggest helps you quickly narrow down your search results by suggesting possible matches as you type.
Showing results for
Partner - Creator
2017-06-22
11:54 PM
- Mark as New
- Bookmark
- Subscribe
- Mute
- Subscribe to RSS Feed
- Permalink
- Report Inappropriate Content
Top 10 & Top 20 Mean
Hi,
I am showing below data in straight table ,but stuck with how to show mean for top 10 and top 20 records, can someone please suggest how to achieve it.
288 Views
2 Replies
2017-06-23
12:12 AM
- Mark as New
- Bookmark
- Subscribe
- Mute
- Subscribe to RSS Feed
- Permalink
- Report Inappropriate Content
Top 10 and 20? They are two reports? You want to show in single report? Will you explain little more and please provide Mock up Application
Best Anil, When applicable please mark the correct/appropriate replies as "solution" (you can mark up to 3 "solutions". Please LIKE threads if the provided solution is helpful
232 Views
Master III
2017-06-23
12:49 AM
- Mark as New
- Bookmark
- Subscribe
- Mute
- Subscribe to RSS Feed
- Permalink
- Report Inappropriate Content
Not sure. May be try like
=Avg(aggr(if(Rank(total CurretColumExpression)<=10, CurretColumExpression), YourDimension))
232 Views