Unlock a world of possibilities! Login now and discover the exclusive benefits awaiting you.
- Qlik Community
- :
- All Forums
- :
- QlikView App Dev
- :
- Top 20 claims on company level
- Subscribe to RSS Feed
- Mark Topic as New
- Mark Topic as Read
- Float this Topic for Current User
- Bookmark
- Subscribe
- Mute
- Printer Friendly Page
- Mark as New
- Bookmark
- Subscribe
- Mute
- Subscribe to RSS Feed
- Permalink
- Report Inappropriate Content
Top 20 claims on company level
Hi Friends,
I need to show top and bottom 20 claims on company level for current year based on premium
year Claim No AAAAAA BBBBB CCCCC
2014 120120 12456 24561 51423
2014 52146 4523 47521 86241
can anyone please help me out.
Regards
krishna
- Tags:
- new_to_qlikview
- « Previous Replies
-
- 1
- 2
- Next Replies »
Accepted Solutions
- Mark as New
- Bookmark
- Subscribe
- Mute
- Subscribe to RSS Feed
- Permalink
- Report Inappropriate Content
Create a Pivot Table
Dimension
1) Year
2) Calculated Dimension
=IF(Aggr(Rank(SUM(Premium),4),Year,Claim No])<=3 or Aggr(Rank(-SUM(Premium),4),Year,[Claim No])<=3,[Claim No])
For both Dimensions Tick Suppress When Value is NULL
Expression
SUM({<Year = {'$(=Year(Today()))'}>}Premium)
- Mark as New
- Bookmark
- Subscribe
- Mute
- Subscribe to RSS Feed
- Permalink
- Report Inappropriate Content
Hi!
Easiest way is sum-premiums, sort table asc on sum and apply max number: -> best
Copy that chart and turn sort to desc. -> worst
Br,
Miikka
Climber Finland
- Mark as New
- Bookmark
- Subscribe
- Mute
- Subscribe to RSS Feed
- Permalink
- Report Inappropriate Content
Hi Kalyan,
Please post your req clearly then some one surely help you.
please post clearly even if its taking time then you will get solution easily that way you can save the time to apply in the live system.
Thanks,
Ajay
- Mark as New
- Bookmark
- Subscribe
- Mute
- Subscribe to RSS Feed
- Permalink
- Report Inappropriate Content
Hi Miikka ,
Thanks for your reply.
Sorry , i forgot to mention that i need to show in Pivort chart.
Because , i'm adding dimensions from different tables..
Thanks & Regards,
krishna
- Mark as New
- Bookmark
- Subscribe
- Mute
- Subscribe to RSS Feed
- Permalink
- Report Inappropriate Content
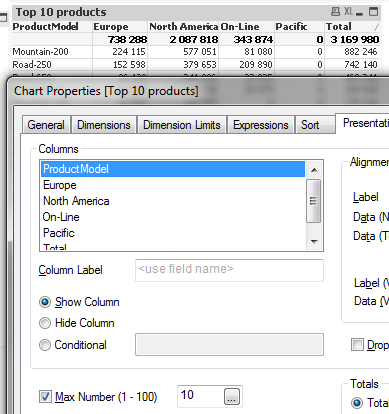
Hi!
This is from my demo app. This shows Europe's top 10 products:
=If(Rank(Sum( {$<Group = {"Europe"}>} LineSalesAmount_US)) <= 10,
Sum( {$<Group = {"Europe"}>} LineSalesAmount_US)
)
First it calculates rank. If rank is in top 10 then it will calculate sales.
Br,
Miikka
Climber Finland
- Mark as New
- Bookmark
- Subscribe
- Mute
- Subscribe to RSS Feed
- Permalink
- Report Inappropriate Content
Create a Pivot Table
Dimension
1) Year
2) Calculated Dimension
=IF(Aggr(Rank(SUM(Premium),4),Year,Claim No])<=3 or Aggr(Rank(-SUM(Premium),4),Year,[Claim No])<=3,[Claim No])
For both Dimensions Tick Suppress When Value is NULL
Expression
SUM({<Year = {'$(=Year(Today()))'}>}Premium)
- Mark as New
- Bookmark
- Subscribe
- Mute
- Subscribe to RSS Feed
- Permalink
- Report Inappropriate Content
Hi,
There is no Dimension limit tab in pivot table,
For displaying top results in pivot table you have to use rank function with aggrigation.
thanks
- Mark as New
- Bookmark
- Subscribe
- Mute
- Subscribe to RSS Feed
- Permalink
- Report Inappropriate Content
Hi Manish,
Thank you for your reply,
Please let me know .what is '4' will do in this expression and this expression for TOP and Bottom customers right?
=IF(Aggr(Rank(SUM(Premium),4),Year,Claim No])<=3 or Aggr(Rank(-SUM(Premium),4),Year,[Claim No])<=3,[Claim No])
Thanks & Regards,
Krishna
- Mark as New
- Bookmark
- Subscribe
- Mute
- Subscribe to RSS Feed
- Permalink
- Report Inappropriate Content
Consider that SUM(Premium) is same for two Claim No, Rank(Expression,4) will make sure that different Rank will be provided for each Claim NO... otherwise you will get Rank as below
1
2-3
2-3
4
5-6
5-6
7
- Mark as New
- Bookmark
- Subscribe
- Mute
- Subscribe to RSS Feed
- Permalink
- Report Inappropriate Content
Hi Manish,
Thank Your for your reply, i got it. But i'm unable to display the ranking order.Im getting top 20.for this top top 20. i need to give rank. How can it be?
Pls help me out.
Thanks & Regards
krishna
- « Previous Replies
-
- 1
- 2
- Next Replies »